ADX
Type:
adx• Category:indicators
Description
Average Directional Movement Index
Parameters
| Name | Type | Description | Required | Default |
|---|---|---|---|---|
dataExp | string | prices data | no | |
high | string | select the column with highest prices | no | |
low | string | select the column with lowest prices | no | |
close | string | select the column with closing prices | no | |
timeperiod | number | Number of periods to use for ADX calculation | no | 14 |
Help
ADX (Average Directional Movement Index)
Description
The Average Directional Movement Index (ADX) is a technical indicator used in financial analysis to measure the strength of a trend. It is a popular tool used to identify and confirm trends, as well as to determine the strength of a trend.
The ADX indicator is composed of three lines:
- The ADX line, which measures the strength of the trend
- The Positive Directional Indicator (+DI) line, which measures the upward price movement
- The Negative Directional Indicator (-DI) line, which measures the downward price movement
What does this worker do?
This worker calculates the Average Directional Movement Index (ADX) for a given set of price data. It takes the following parameters:
dataExp: prices datahigh: select the column with highest priceslow: select the column with lowest pricesclose: select the column with closing pricestimeperiod: Number of periods to use for ADX calculation
How to interpret the results
The ADX indicator can be interpreted as follows:
- A high ADX value (> 25) indicates a strong trend, either up or down.
- A low ADX value (< 20) indicates a weak or absent trend.
- A rising ADX line indicates an increasing trend strength, while a falling ADX line indicates a decreasing trend strength.
The +DI and -DI lines can be used to determine the direction of the trend:
- When the +DI line is above the -DI line, it indicates an upward trend.
- When the -DI line is above the +DI line, it indicates a downward trend.
Usage
To use this worker, simply provide the required parameters and it will calculate the ADX indicator for you.
Example usage
You can use this worker by passing in your price data and selecting the relevant columns.
Visualizing the ADX Indicator
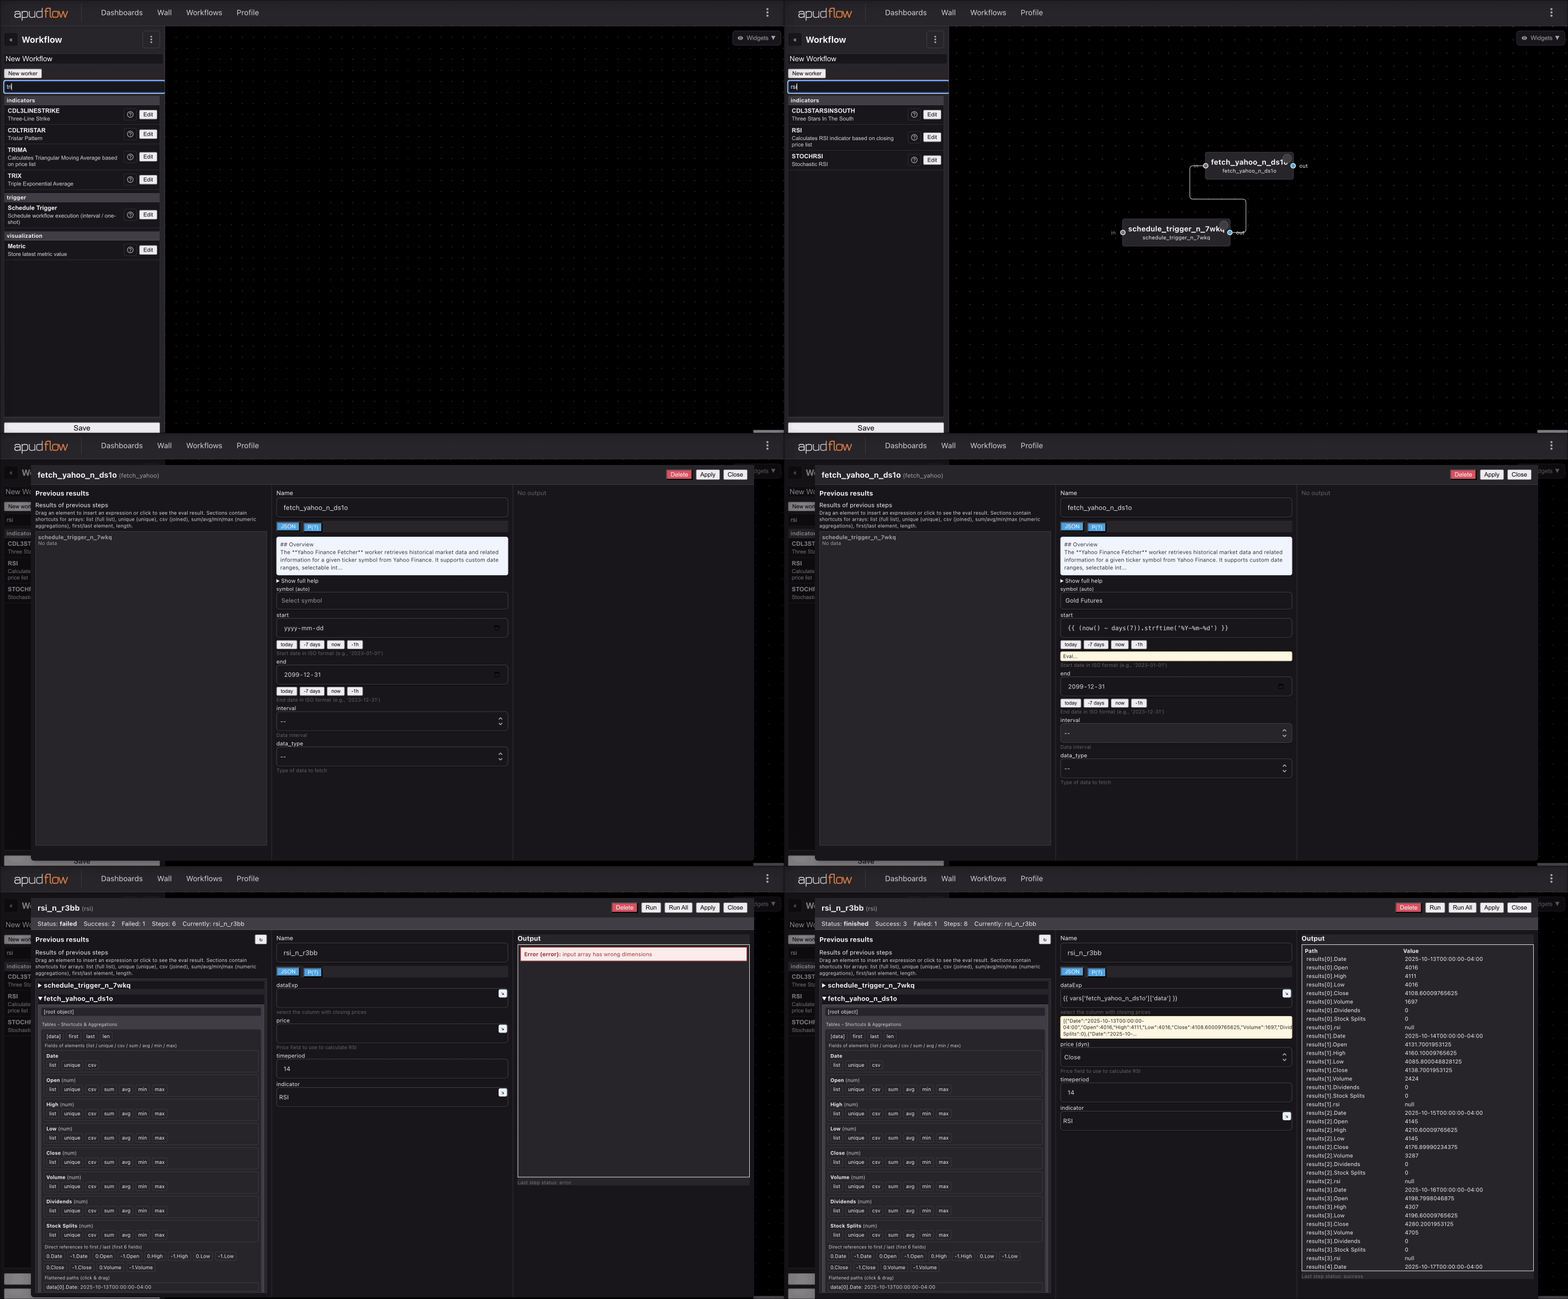
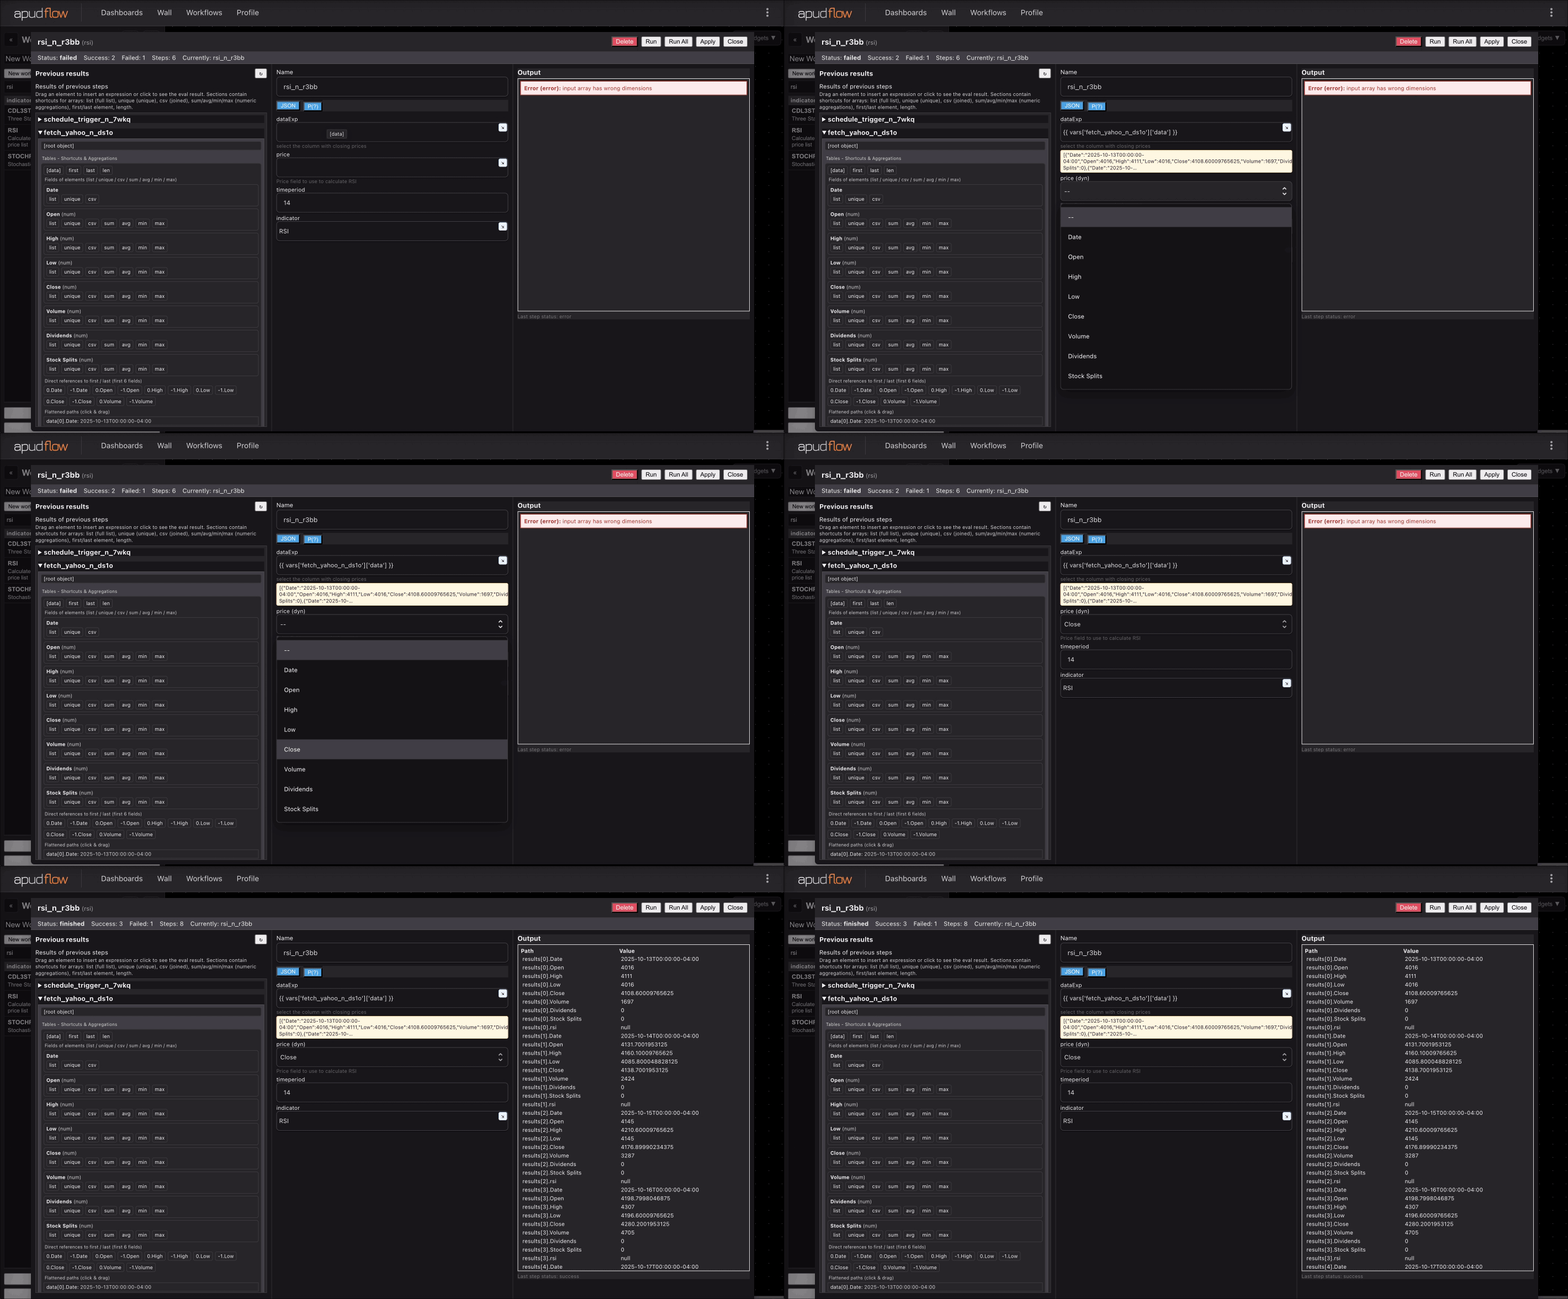
For a better understanding of how to use the ADX indicator, you can refer to the following images:
Full ADX Indicator Example

Short ADX Indicator Example

Additional Information
The ADX indicator was developed by J. Welles Wilder Jr. and is widely used in technical analysis. It is often used in combination with other indicators to form a trading strategy.
By using the ADX indicator, traders and analysts can gain insights into the strength and direction of a trend, which can help inform investment decisions.