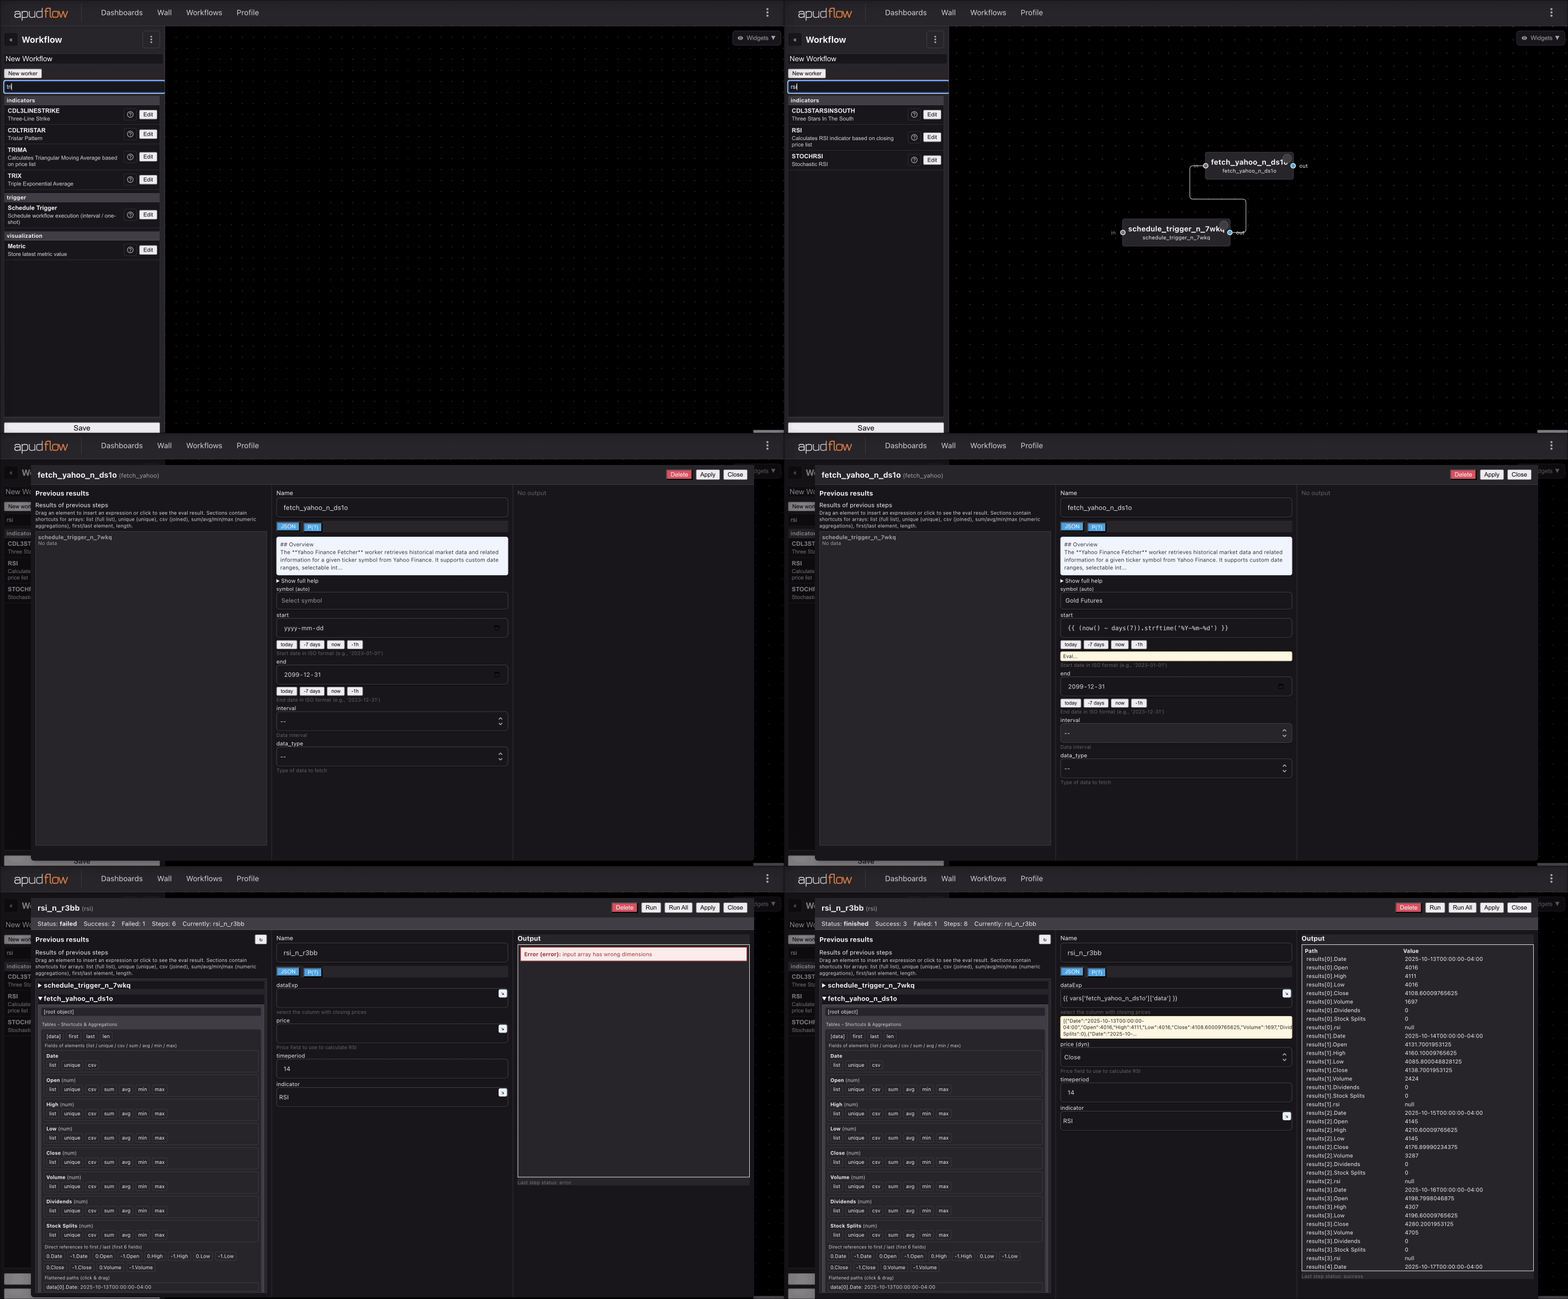
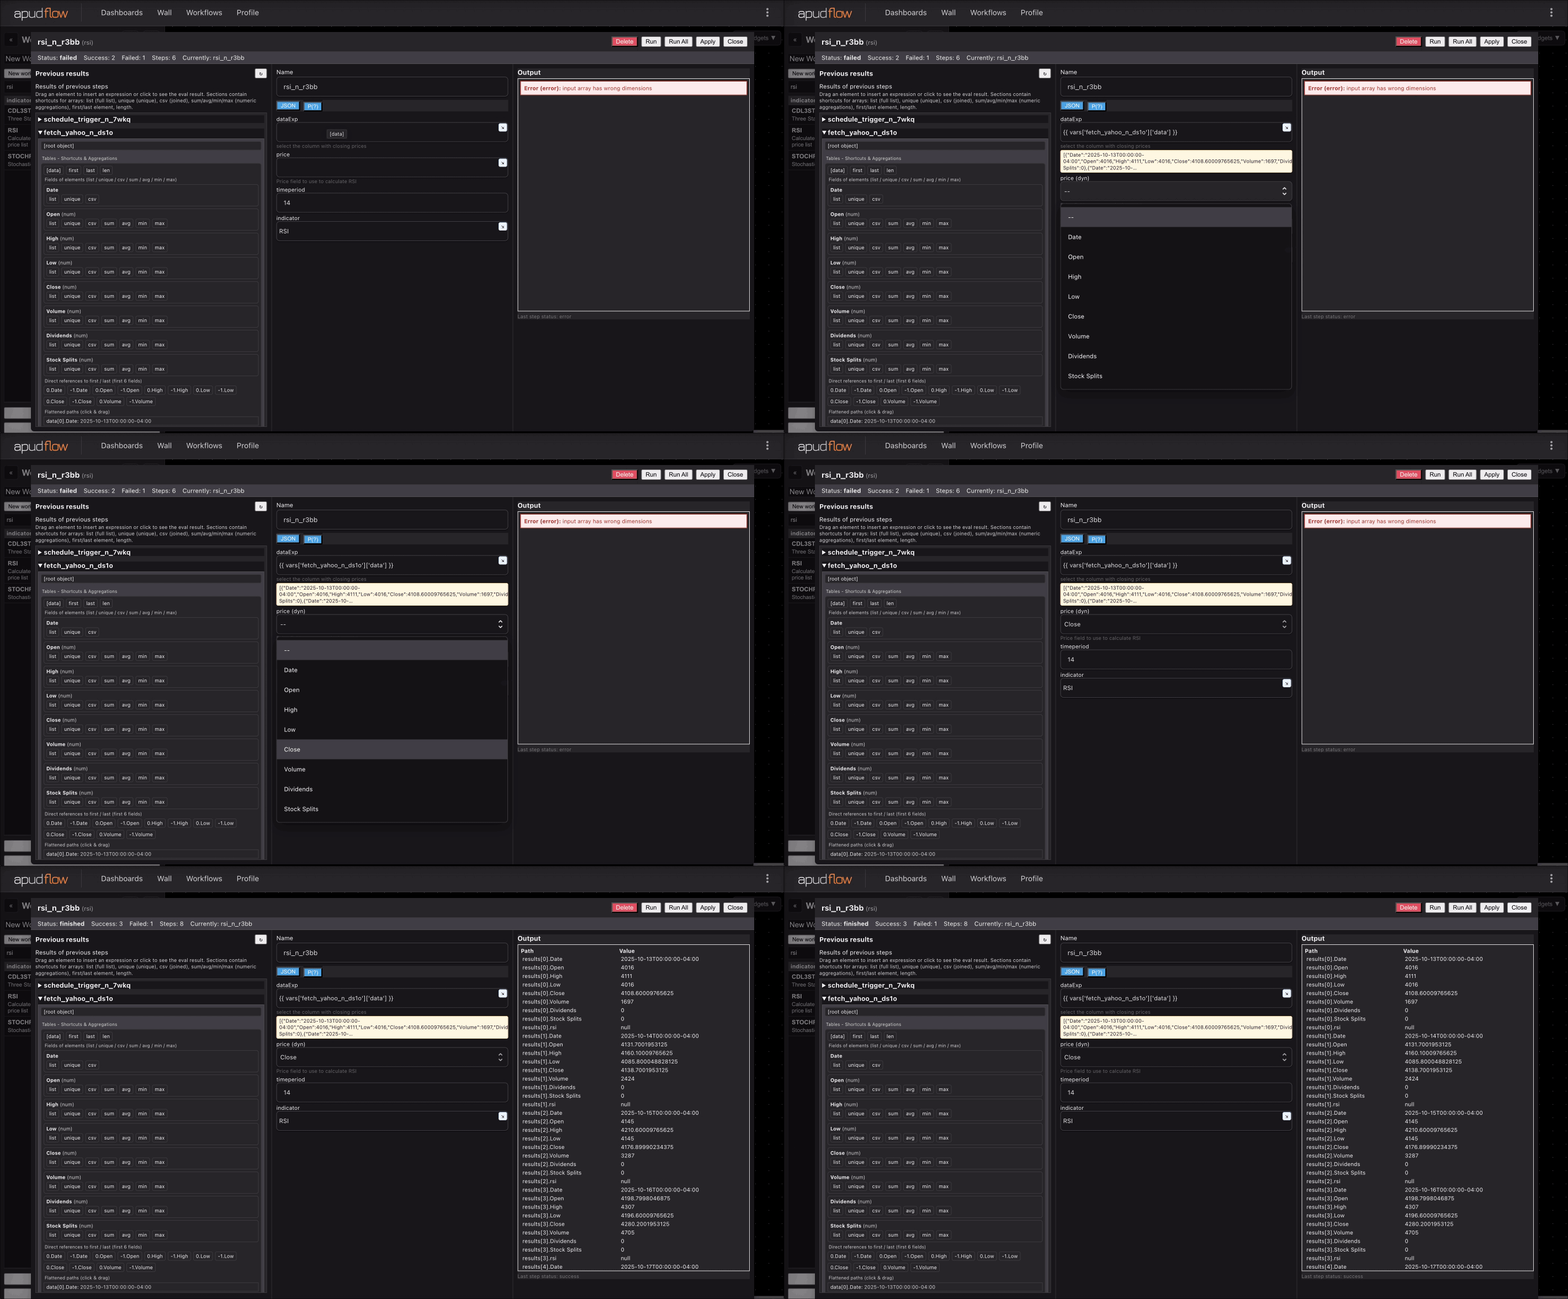
TRIMA
Type:
trima• Category:indicators
Description
Calculates Triangular Moving Average based on price list
Parameters
| Name | Type | Description | Required | Default |
|---|---|---|---|---|
dataExp | string | prices data | no | |
price | string | Price field to use to calculate TRIMA | no | |
timeperiod | number | Number of periods to use for TRIMA calculation | no | 30 |
indicator | string | no | "TRIMA" |
Help
TRIMA
Triangular Moving Average Indicator
Description
The TRIMA (Triangular Moving Average) indicator is a technical analysis tool used in financial markets to smooth out price data and identify trends. It is a type of moving average that uses a triangular weighting scheme to give more importance to the middle period.
What does this worker do?
This worker calculates the Triangular Moving Average based on a given price list. It takes in the following parameters:
dataExp: prices dataprice: Price field to use to calculate TRIMAtimeperiod: Number of periods to use for TRIMA calculationindicator: No description
How to interpret the results
The TRIMA indicator can be used to:
- Identify trends: A rising TRIMA indicates an uptrend, while a falling TRIMA indicates a downtrend.
- Smooth out price data: TRIMA helps to reduce noise and smooth out price fluctuations.
- Generate signals: TRIMA can be used to generate buy and sell signals when it crosses above or below the price.
How to use it
To use this worker, simply provide the required parameters and it will calculate the TRIMA indicator. You can use the resulting values to analyze and visualize the trend.
Visualizing the TRIMA Indicator
For a better understanding of how to use the TRIMA indicator, you can refer to the following GIFs:
Full GIF
[](https://pub-6c7cc7f707d94ca98153d59a039b9a3d.r2.dev/indicator_full.gif)
Short GIF
[](https://pub-6c7cc7f707d94ca98153d59a039b9a3d.r2.dev/indicator_short.gif)
Additional Information
The Triangular Moving Average was developed by Patrick G. Mullineaux in the early 1990s. It is considered a more responsive and smoother indicator compared to traditional moving averages. The TRIMA indicator is often used in combination with other technical analysis tools to confirm trading decisions.
Example Use Case
The TRIMA indicator can be used in a trading strategy to generate buy and sell signals. For example, a trader can use a short-term TRIMA (e.g., 10-period) and a long-term TRIMA (e.g., 30-period) to generate signals when the short-term TRIMA crosses above or below the long-term TRIMA.