Alpha#18
Type:
alpha_18• Category:indicators
Description
Alpha#18 - indicator based on volatility and correlation of close and open.
Parameters
| Name | Type | Description | Required | Default |
|---|---|---|---|---|
dataExp | string | price data | no | |
close | string | select the column with closing prices | no | |
open | string | select the column with opening prices | no |
Help
Alpha#18
Description
Alpha#18 is an indicator used in investing strategy, specifically in the 101 Formulaic Alphas. This indicator is based on the volatility and correlation of close and open prices.
What does this worker do?
This worker calculates the Alpha#18 indicator, which is a measure of the relationship between the volatility and correlation of close and open prices. It provides insight into the market's behavior and can be used to inform investment decisions.
How to interpret the results
The results of the Alpha#18 indicator can be interpreted as a measure of the market's volatility and correlation. A higher value indicates a stronger relationship between the close and open prices, while a lower value indicates a weaker relationship.
Parameters
The following parameters are required to calculate the Alpha#18 indicator:
- dataExp: price data
- Type: DataFrame
- Description: The input price data
- close: select the column with closing prices
- Type: string
- Description: The column name of the closing prices in the dataExp DataFrame
- open: select the column with opening prices
- Type: string
- Description: The column name of the opening prices in the dataExp DataFrame
Usage
To use this worker, simply provide the required parameters and run the calculation. The result will be the Alpha#18 indicator value.
Visualizing the Indicator
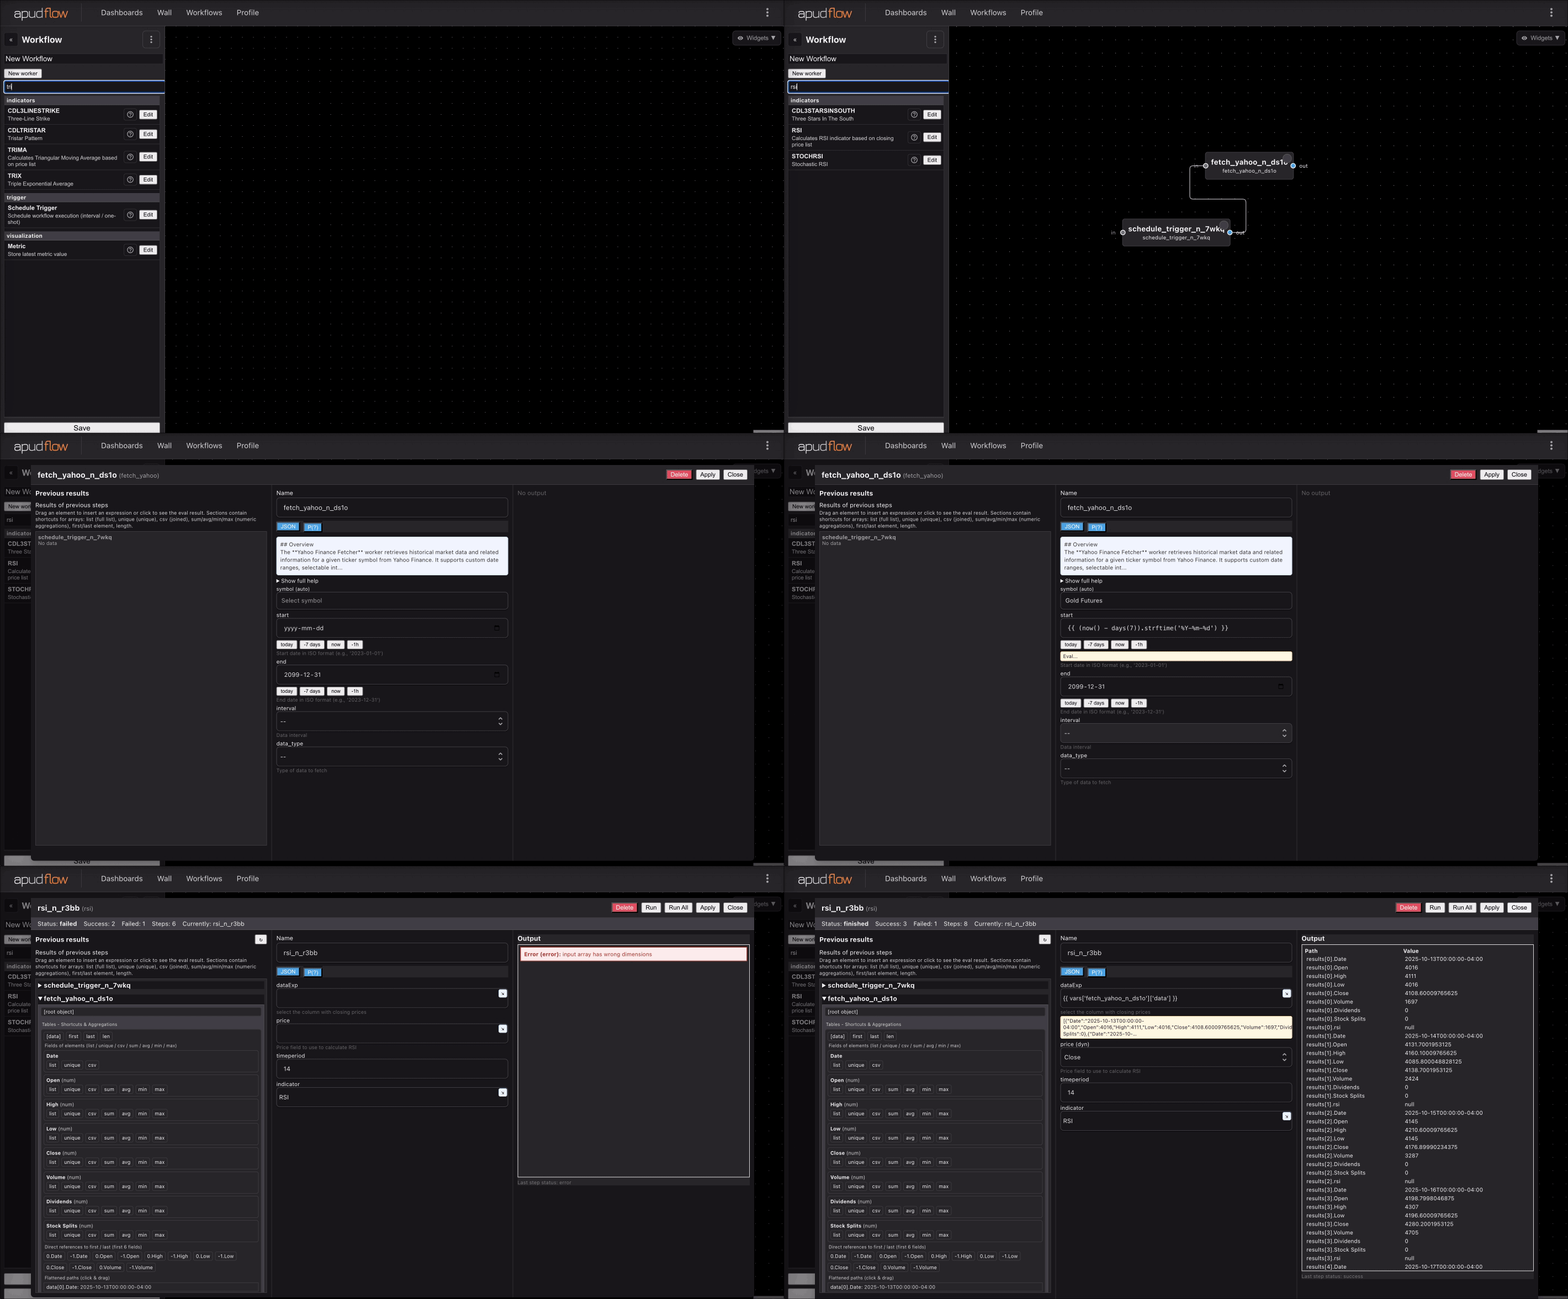
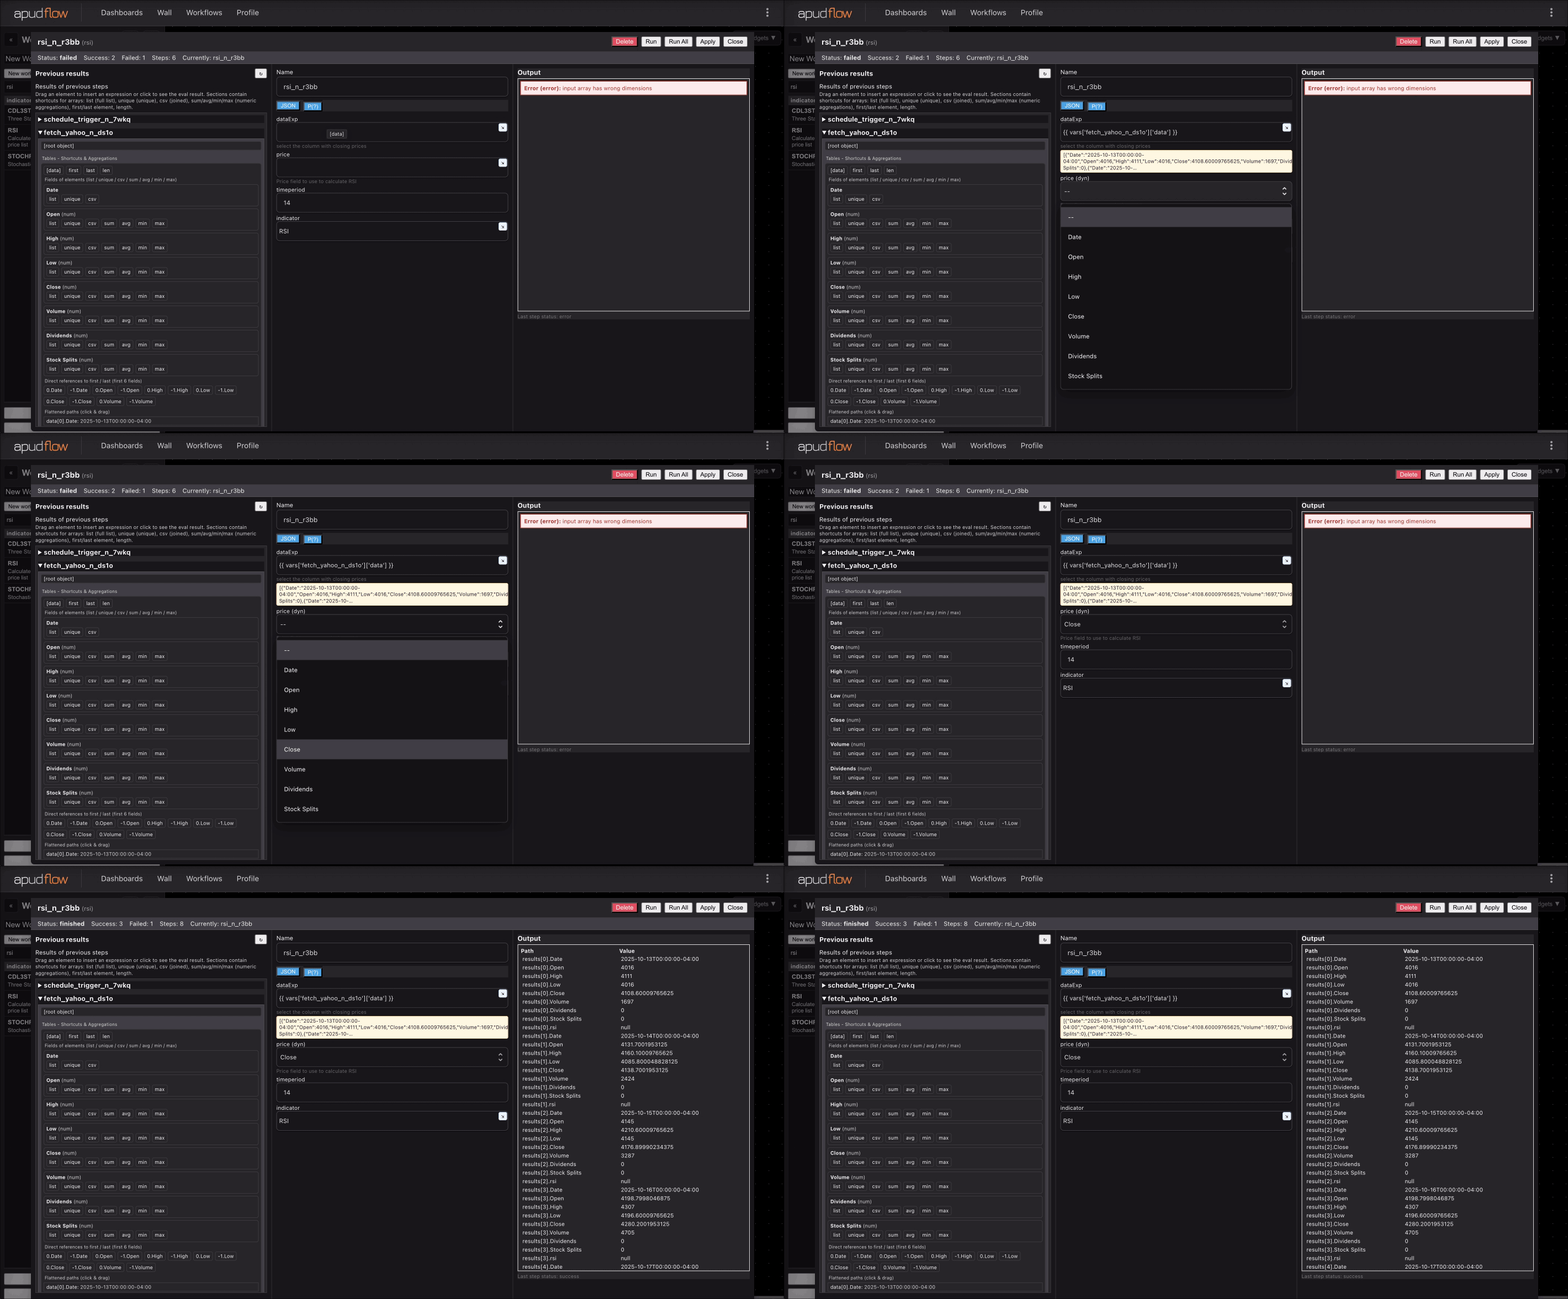
The following images demonstrate how to use the Alpha#18 indicator:


Reference
For more information on the 101 Formulaic Alphas, please refer to the publication by Zura Kakushadze:
- 101 Formulaic Alphas by Zura Kakushadze