TRIX
Type:
trix• Category:indicators
Description
Triple Exponential Average
Parameters
| Name | Type | Description | Required | Default |
|---|---|---|---|---|
dataExp | string | prices data | no | |
price | string | Price field to use to calculate TRIX | no | |
timeperiod | number | Number of periods to use for TRIX calculation | no | 30 |
Help
TRIX
Triple Exponential Average
Description
The TRIX (Triple Exponential Average) is a momentum indicator used in technical analysis of financial markets. It is designed to filter out minor price movements and highlight significant trends. The TRIX indicator is based on the triple exponential smoothing of the price data.
What does this worker do?
The TRIX worker calculates the Triple Exponential Average of a given price data over a specified number of periods. It takes the following parameters:
dataExp: prices dataprice: Price field to use to calculate TRIXtimeperiod: Number of periods to use for TRIX calculation
The worker then returns the TRIX values, which can be used to analyze the momentum and trend of the market.
How to interpret the results
The TRIX indicator can be interpreted in the following ways:
- Crossover above zero: A crossover above the zero line indicates an uptrend in the market.
- Crossover below zero: A crossover below the zero line indicates a downtrend in the market.
- Divergence: A divergence between the TRIX and the price chart can indicate a potential reversal in the trend.
Additional Information
The TRIX indicator was developed by Jack E. Hutson in the 1980s. It is considered a versatile indicator that can be used in various market conditions. When used in conjunction with other indicators, the TRIX can provide a more comprehensive view of the market.
How to use it
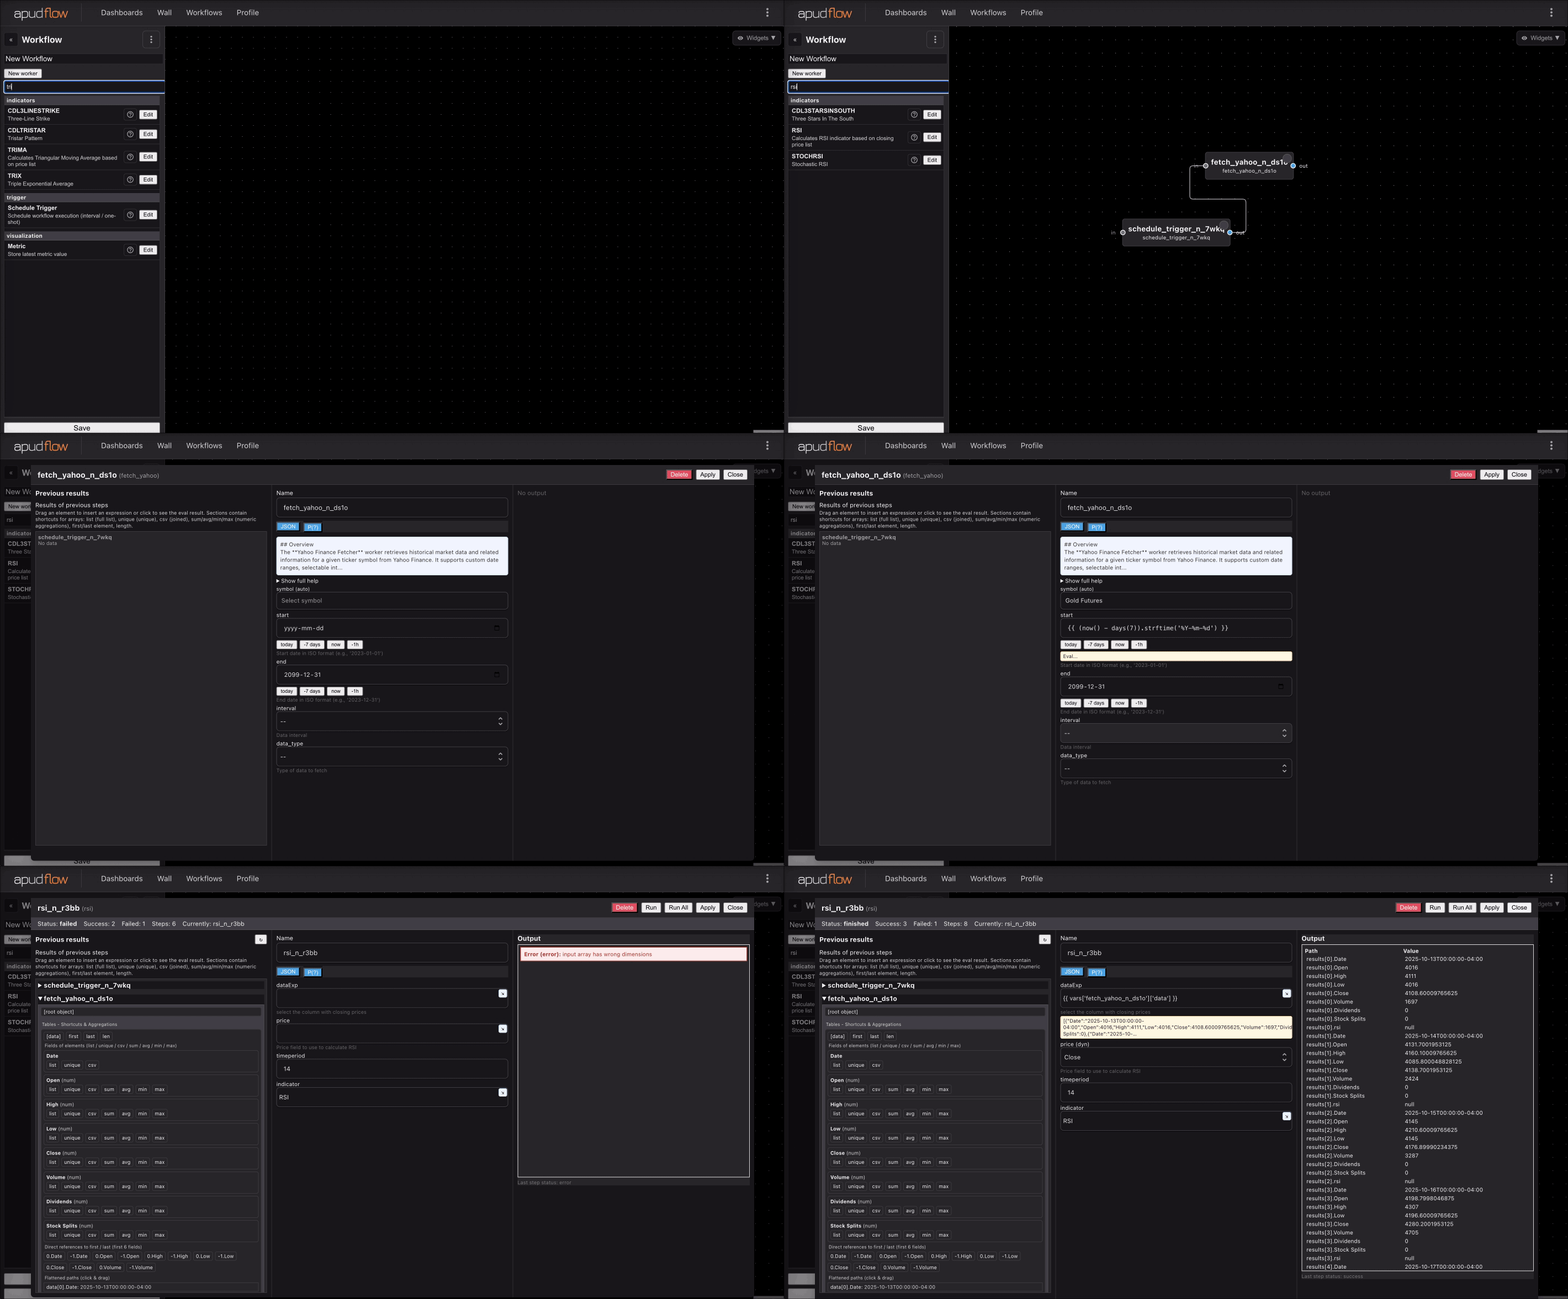
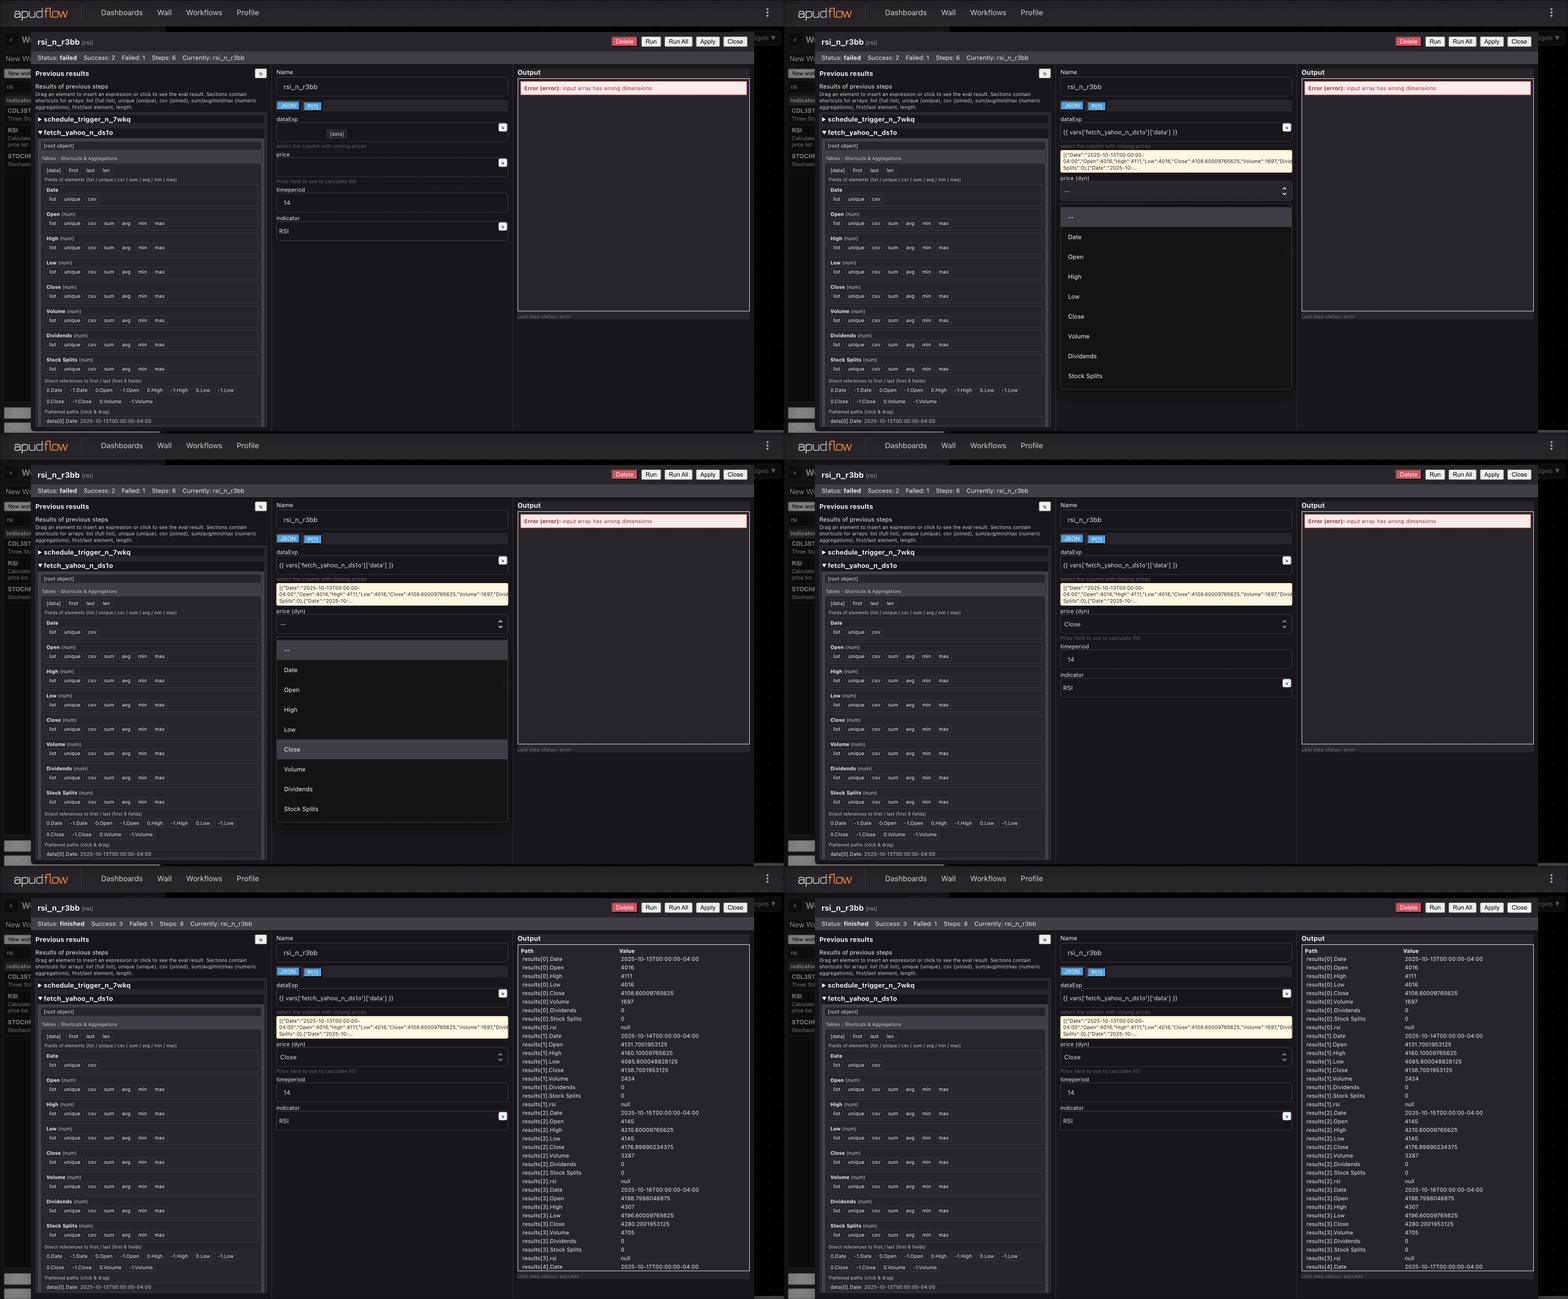
For a visual representation of how to use the TRIX indicator, please refer to the following images:
Full GIF
[](https://pub-6c7cc7f707d94ca98153d59a039b9a3d.r2.dev/indicator_full.gif)
Short GIF
[](https://pub-6c7cc7f707d94ca98153d59a039b9a3d.r2.dev/indicator_short.gif)
These images demonstrate the application of the TRIX indicator in a real-world scenario.
Example Use Cases
- Use the TRIX indicator to confirm trends and identify potential reversals.
- Combine the TRIX with other indicators, such as the Moving Average Convergence Divergence (MACD), to create a comprehensive trading strategy.
By following these guidelines and using the TRIX indicator in conjunction with other technical analysis tools, traders and investors can gain a deeper understanding of market trends and make more informed investment decisions.