Alpha#79
Type:
alpha_79• Category:indicators
Description
Alpha#79 - delta and correlation comparison.
Parameters
| Name | Type | Description | Required | Default |
|---|---|---|---|---|
dataExp | string | price data | no | |
close | string | select the column with closing prices | no | |
open | string | select the column with opening prices | no | |
vwap | string | select the column with VWAP | no | |
volume | string | select the column with volume | no |
Help
Alpha#79
Description
Alpha#79 is an indicator from Alpha 101, a set of formulaic alphas used in investing strategies. This indicator compares delta and correlation.
What does this worker do?
This worker calculates Alpha#79, which involves comparing delta and correlation. The indicator uses price data to generate a signal that can be used in an investing strategy.
How to interpret the results
The results of Alpha#79 can be used to inform investment decisions. A higher value indicates a stronger signal, while a lower value indicates a weaker signal.
Parameters
The following parameters are required to calculate Alpha#79:
- dataExp: pandas.DataFrame Price data
- close: str Select the column with closing prices
- open: str Select the column with opening prices
- vwap: str Select the column with VWAP (Volume-Weighted Average Price)
- volume: str Select the column with volume
Usage
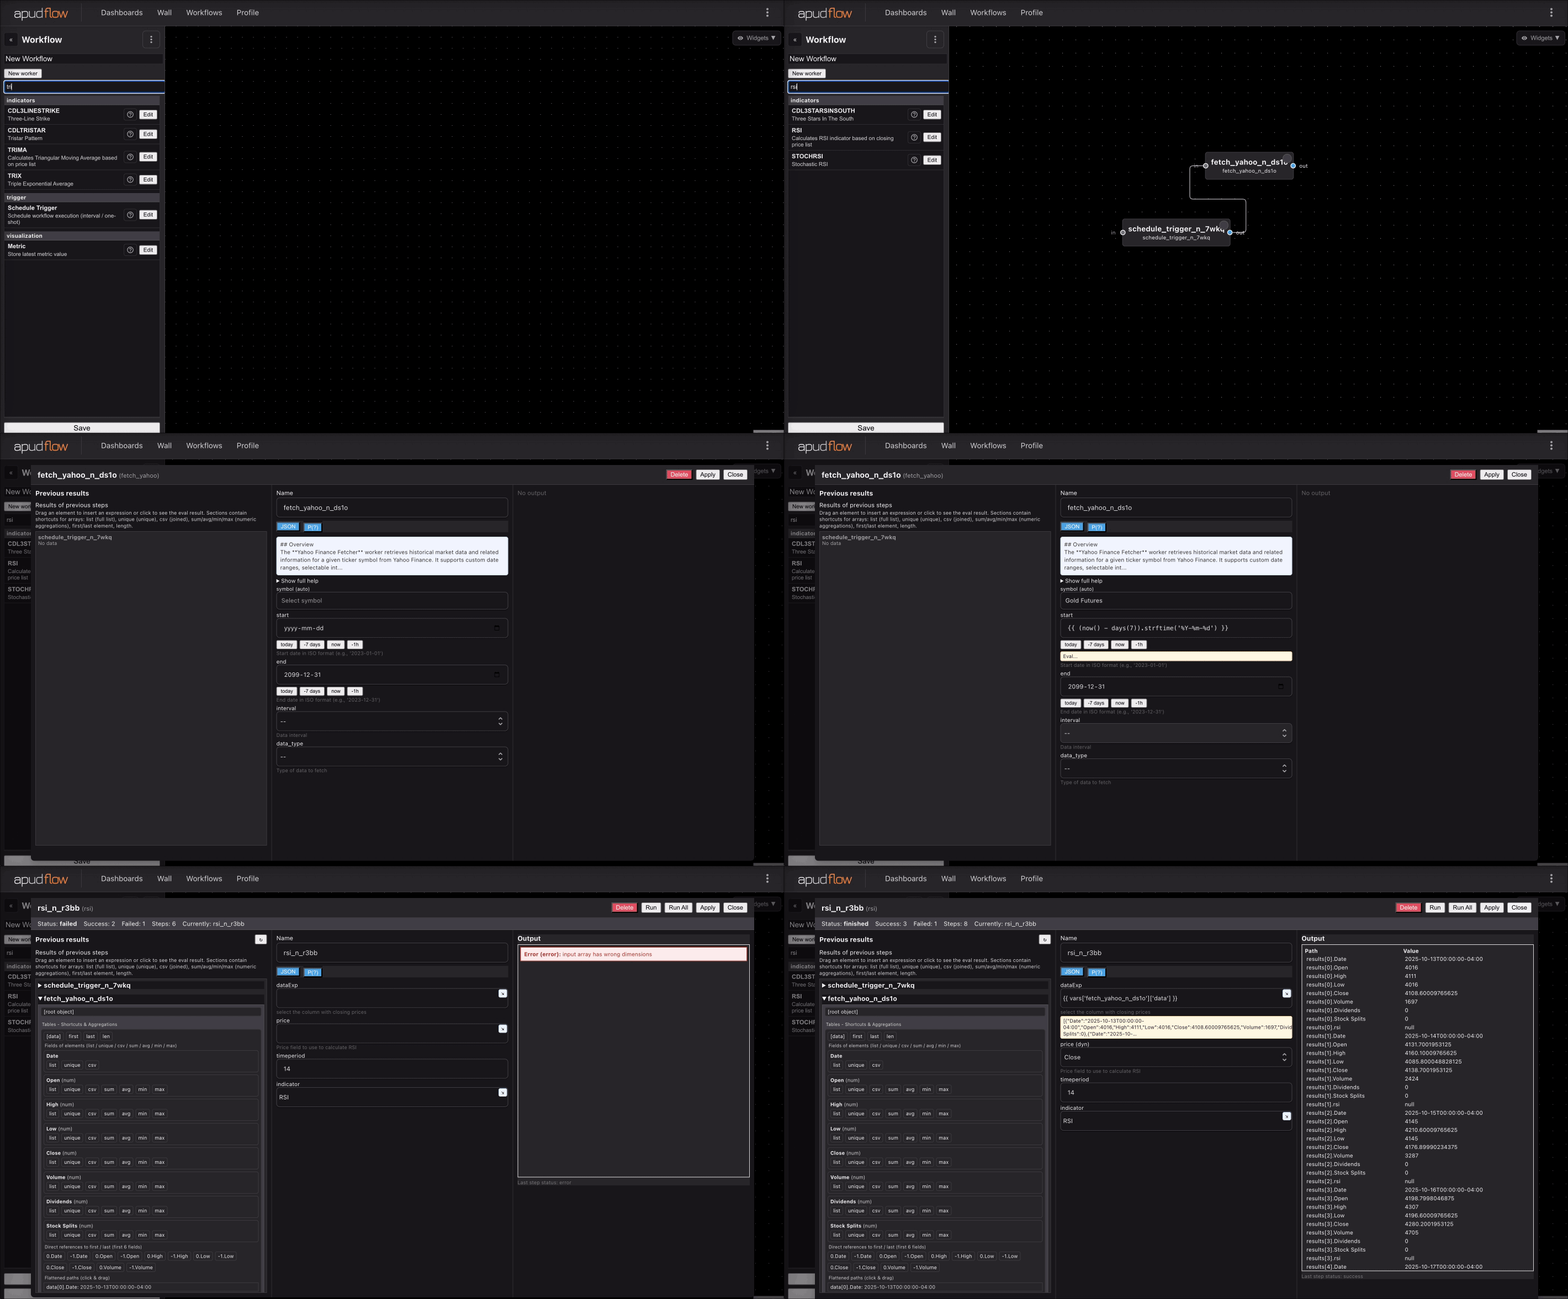
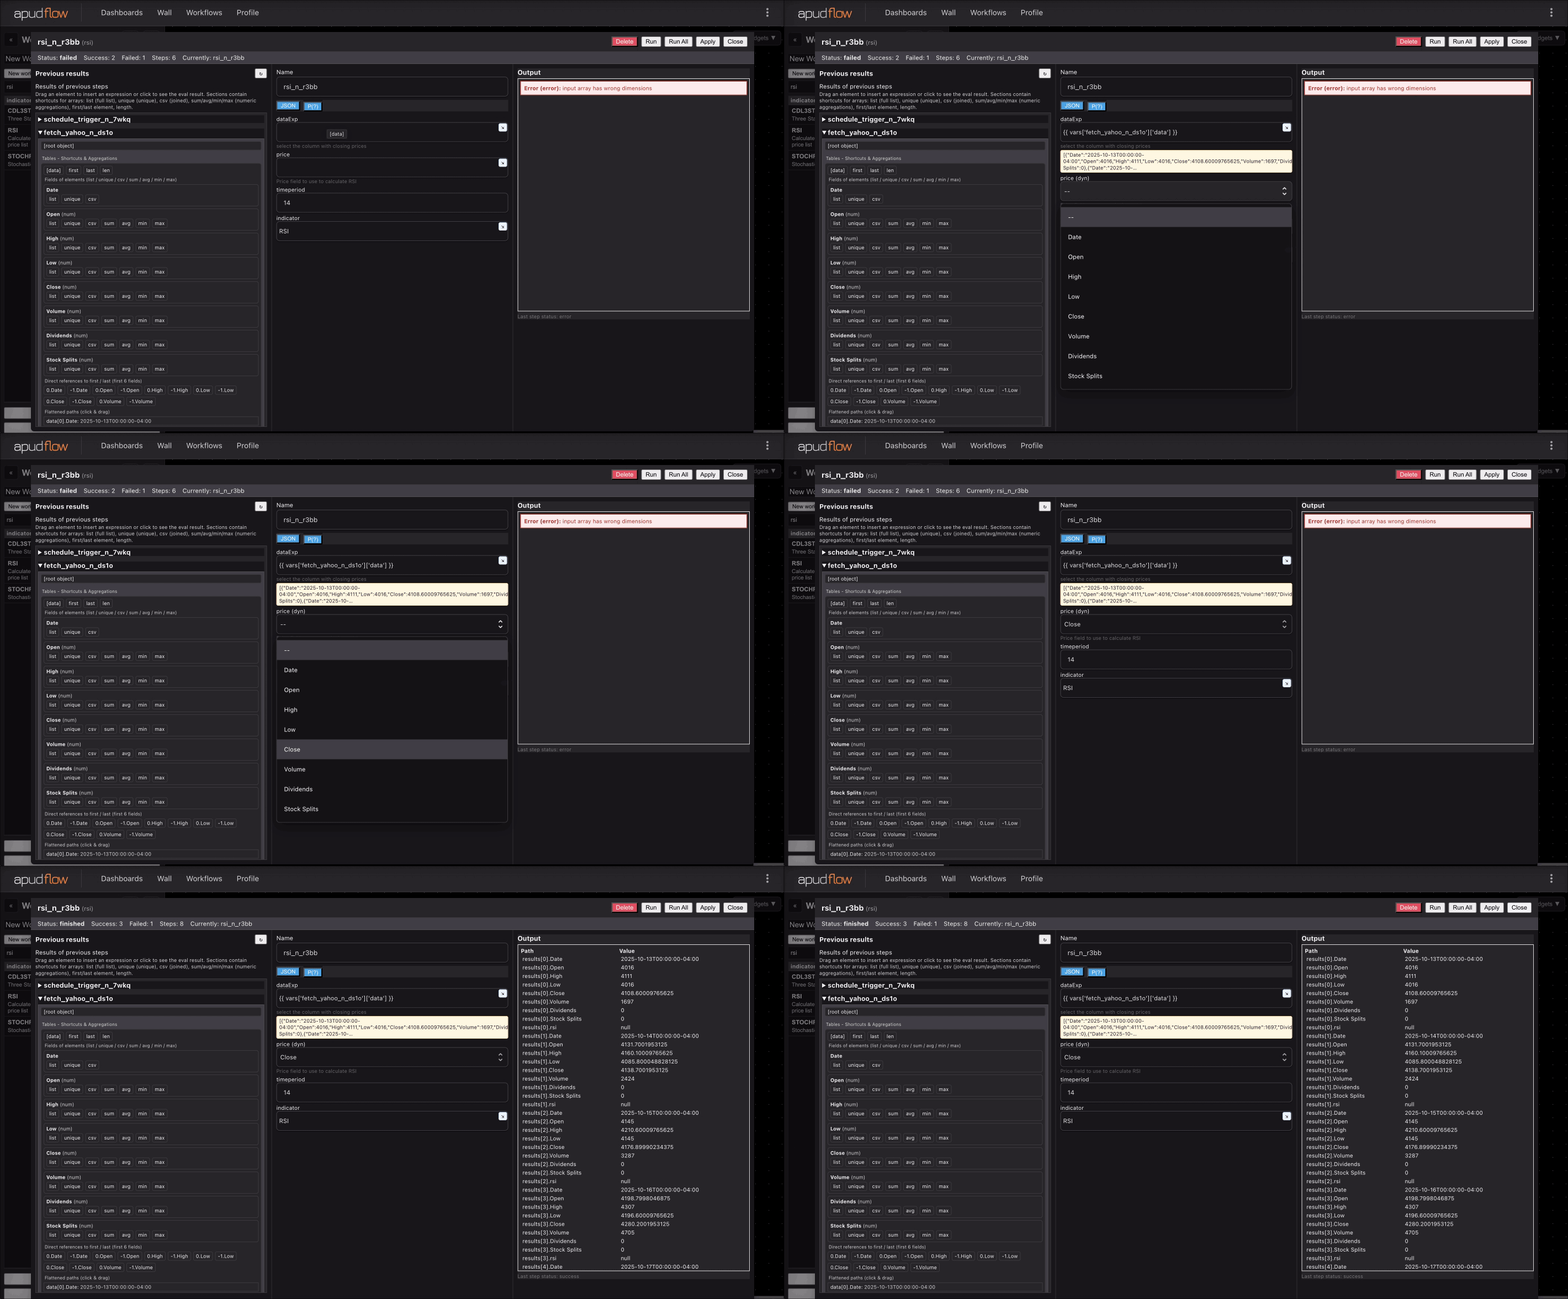
For a visual guide on how to use this indicator, see the following GIFs:


Reference
For more information on Alpha 101 and the 101 Formulaic Alphas, see the publication by Zura Kakushadze:
[101 Formulaic Alphas](https://arxiv.org/pdf/1601.00991.pdf)