HT Trendline
Type:
ht_trendline• Category:indicators
Description
Calculates Hilbert Trendline based on price list
Parameters
| Name | Type | Description | Required | Default |
|---|---|---|---|---|
dataExp | string | prices data | no | |
price | string | Price field to use to calculate HT Trendline | no |
Help
HT Trendline
Description
The HT Trendline worker is an indicator used in financial analysis to calculate the Hilbert Trendline based on a given price list. This indicator helps in identifying the trend of a financial instrument by smoothing out the price data.
What does this worker do?
The HT Trendline worker takes in a dataset of prices (dataExp) and a specific price field (price) as parameters. It then calculates the Hilbert Trendline using the provided price data. The Hilbert Trendline is a type of trendline that uses the Hilbert transform to filter out noise and emphasize the underlying trend.
How to interpret the results
The output of the HT Trendline worker is a smoothed price line that represents the underlying trend of the financial instrument. This trendline can be used to:
- Identify the direction of the trend (upward or downward)
- Determine the strength of the trend
- Make informed trading decisions
Implementation
To use the HT Trendline worker, simply provide the required parameters:
dataExp: The dataset of pricesprice: The specific price field to use for calculating the HT Trendline
Visualizing the HT Trendline
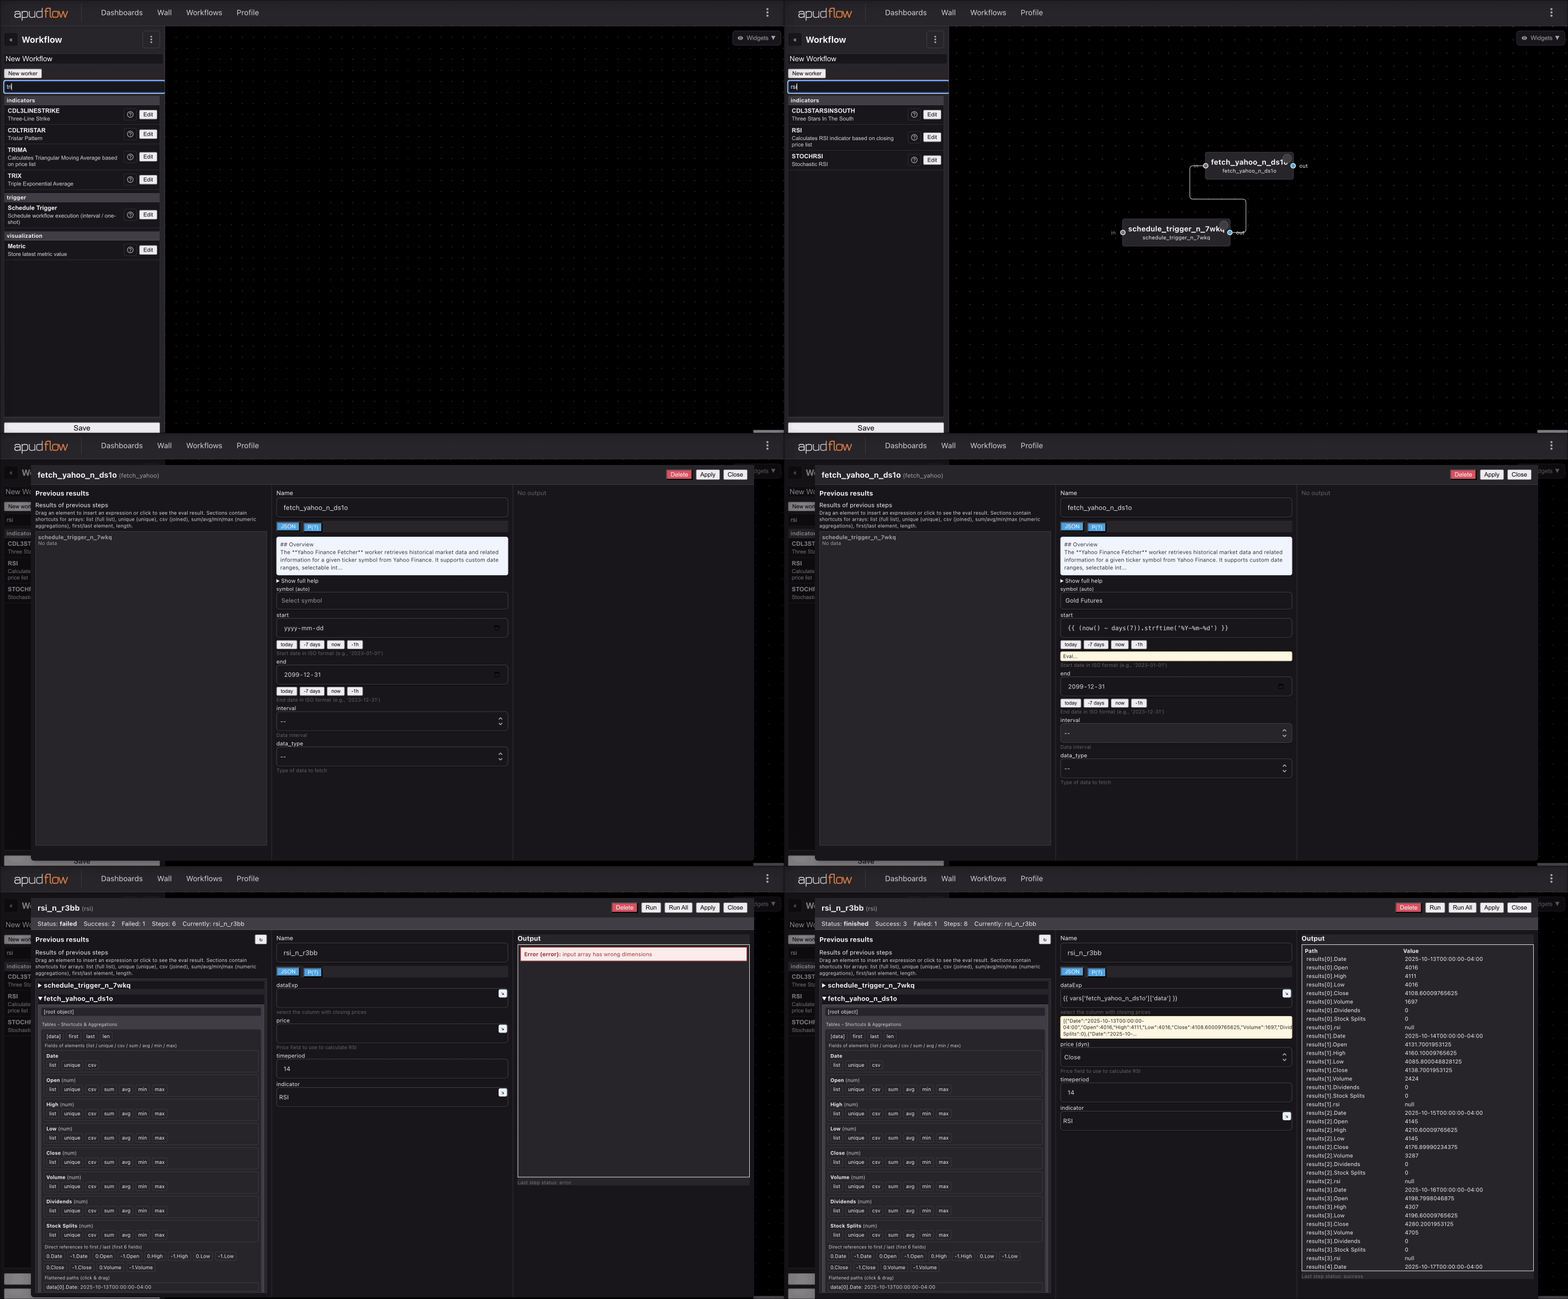
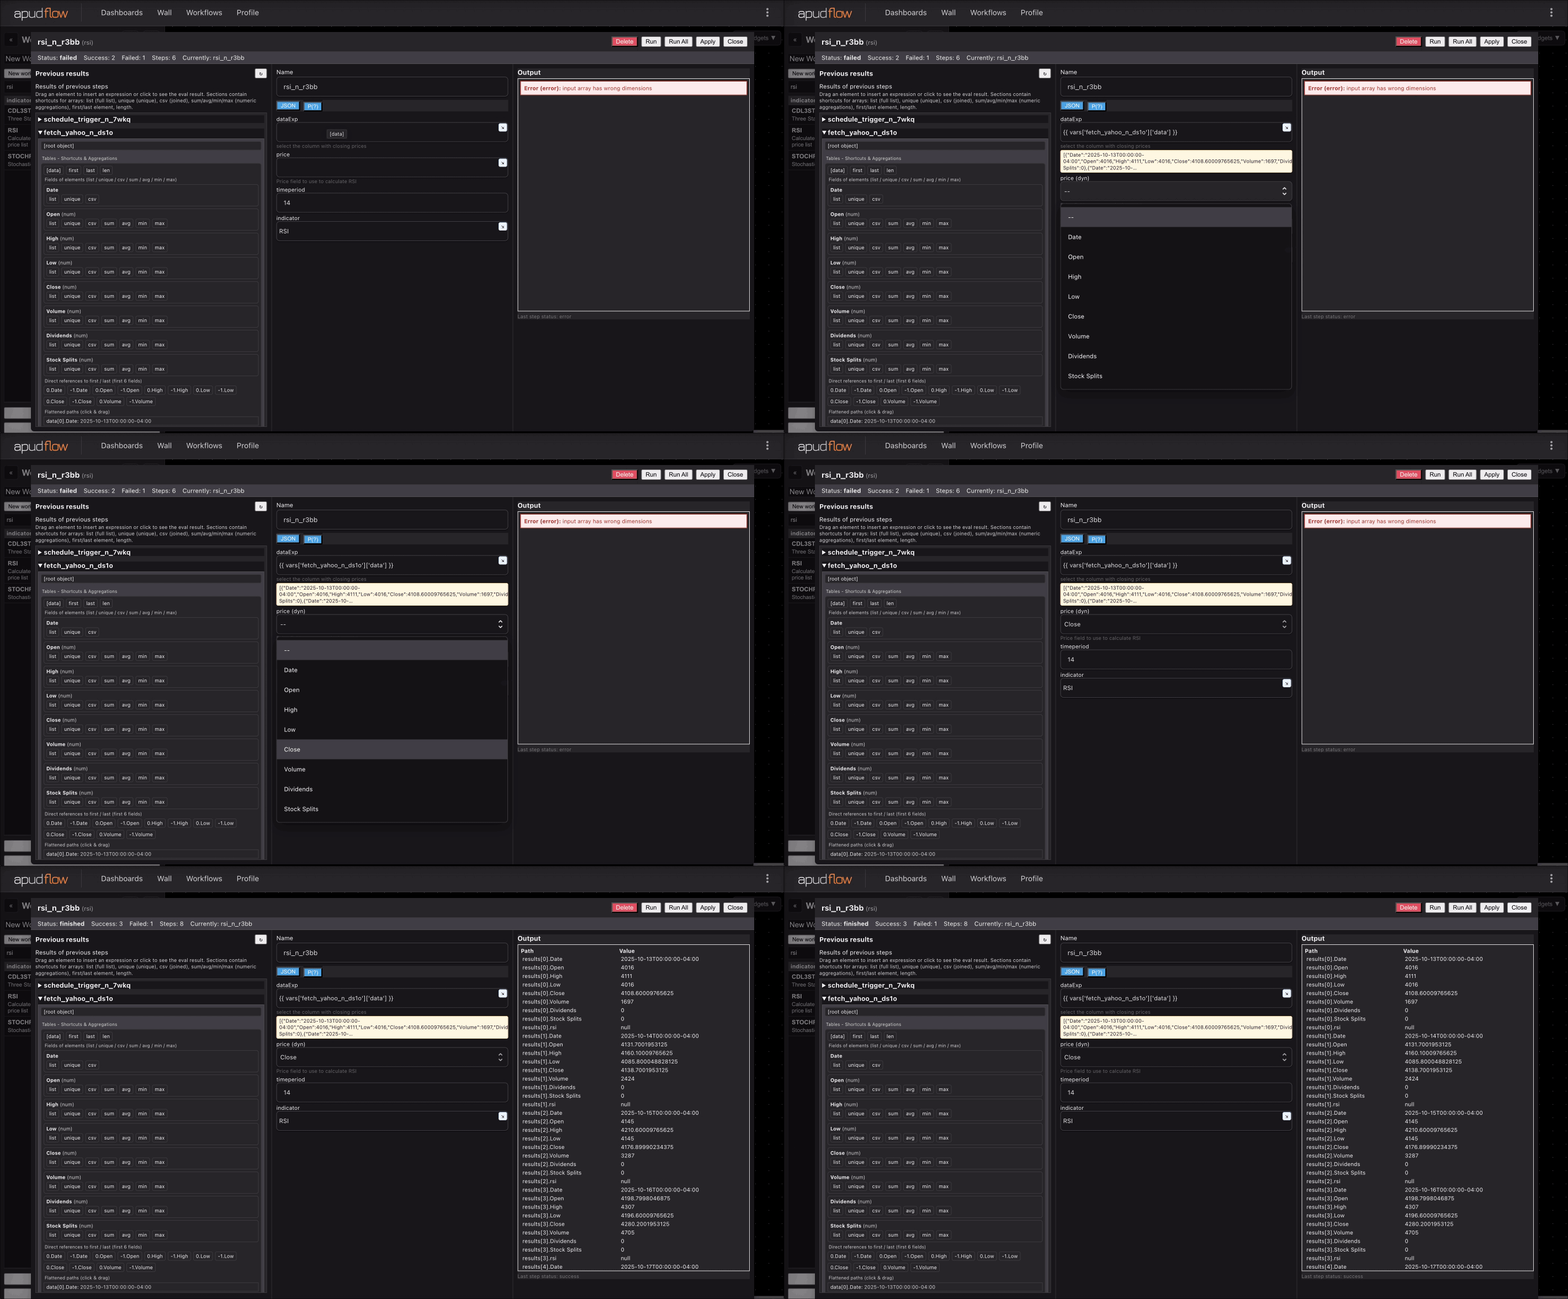
For a better understanding of how to use the HT Trendline worker, refer to the following GIFs:
Full GIF
[](https://pub-6c7cc7f707d94ca98153d59a039b9a3d.r2.dev/indicator_full.gif)
Short GIF
[](https://pub-6c7cc7f707d94ca98153d59a039b9a3d.r2.dev/indicator_short.gif)
Additional Information
The Hilbert Trendline is a technical analysis tool developed by Mark Jurik, a well-known expert in the field of technical analysis. It is designed to provide a more accurate representation of the underlying trend by reducing the impact of noise and volatility. The HT Trendline can be used in various financial markets, including stocks, forex, and commodities.
Parameters
dataExp: Prices dataprice: Price field to use to calculate HT Trendline