ADXR
Type:
adxr• Category:indicators
Description
Average Directional Movement Index Rating
Parameters
| Name | Type | Description | Required | Default |
|---|---|---|---|---|
dataExp | string | prices data | no | |
high | string | select the column with highest prices | no | |
low | string | select the column with lowest prices | no | |
close | string | select the column with closing prices | no | |
timeperiod | number | Number of periods to use for ADXR calculation | no | 14 |
Help
ADXR
Average Directional Movement Index Rating
The Average Directional Movement Index Rating (ADXR) is a technical indicator used in financial analysis to measure the strength of a trend. It is a variation of the Average Directional Index (ADX) and is used to gauge the effectiveness of a trading strategy.
Description
The ADXR indicator is used to evaluate the strength of a trend by plotting the average directional index over a specified time period. The ADXR is calculated based on the positive and negative directional indicators (+DI and -DI) and provides a smoothed-out version of the ADX.
The ADXR indicator can be used to:
- Determine the strength of a trend
- Identify potential trading opportunities
- Confirm trading decisions
How it Works
The ADXR indicator is calculated using the following parameters:
dataExp: prices datahigh: select the column with highest priceslow: select the column with lowest pricesclose: select the column with closing pricestimeperiod: Number of periods to use for ADXR calculation
The ADXR indicator is calculated as follows:
- Calculate the +DI and -DI indicators
- Calculate the ADX indicator
- Calculate the ADXR indicator by taking the average of the ADX over a specified time period
Interpretation of Results
The ADXR indicator can be interpreted as follows:
- A high ADXR value (> 25) indicates a strong trend
- A low ADXR value (< 20) indicates a weak trend
- A rising ADXR value indicates an increasing trend strength
- A falling ADXR value indicates a decreasing trend strength
Usage
To use the ADXR indicator, simply pass in the required parameters:
ADXR(dataExp, high, low, close, timeperiod)
Visualizing the ADXR Indicator
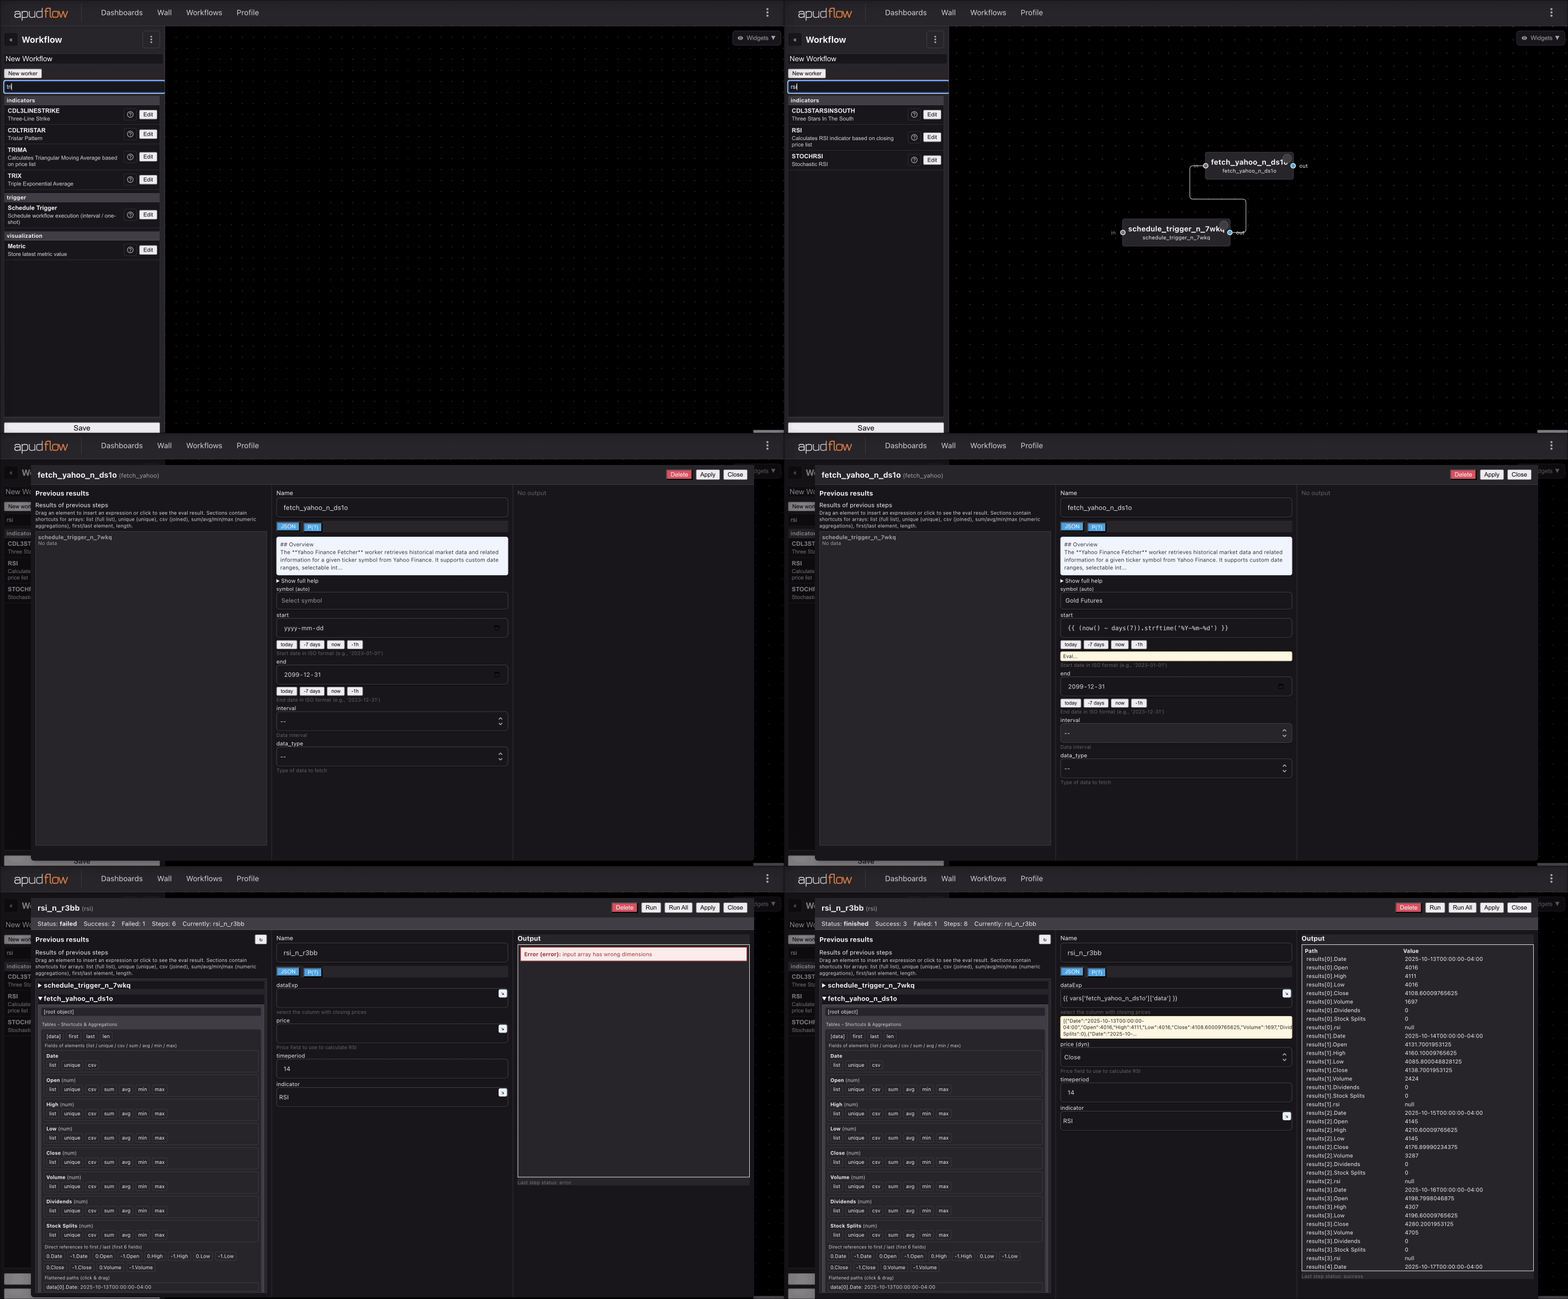
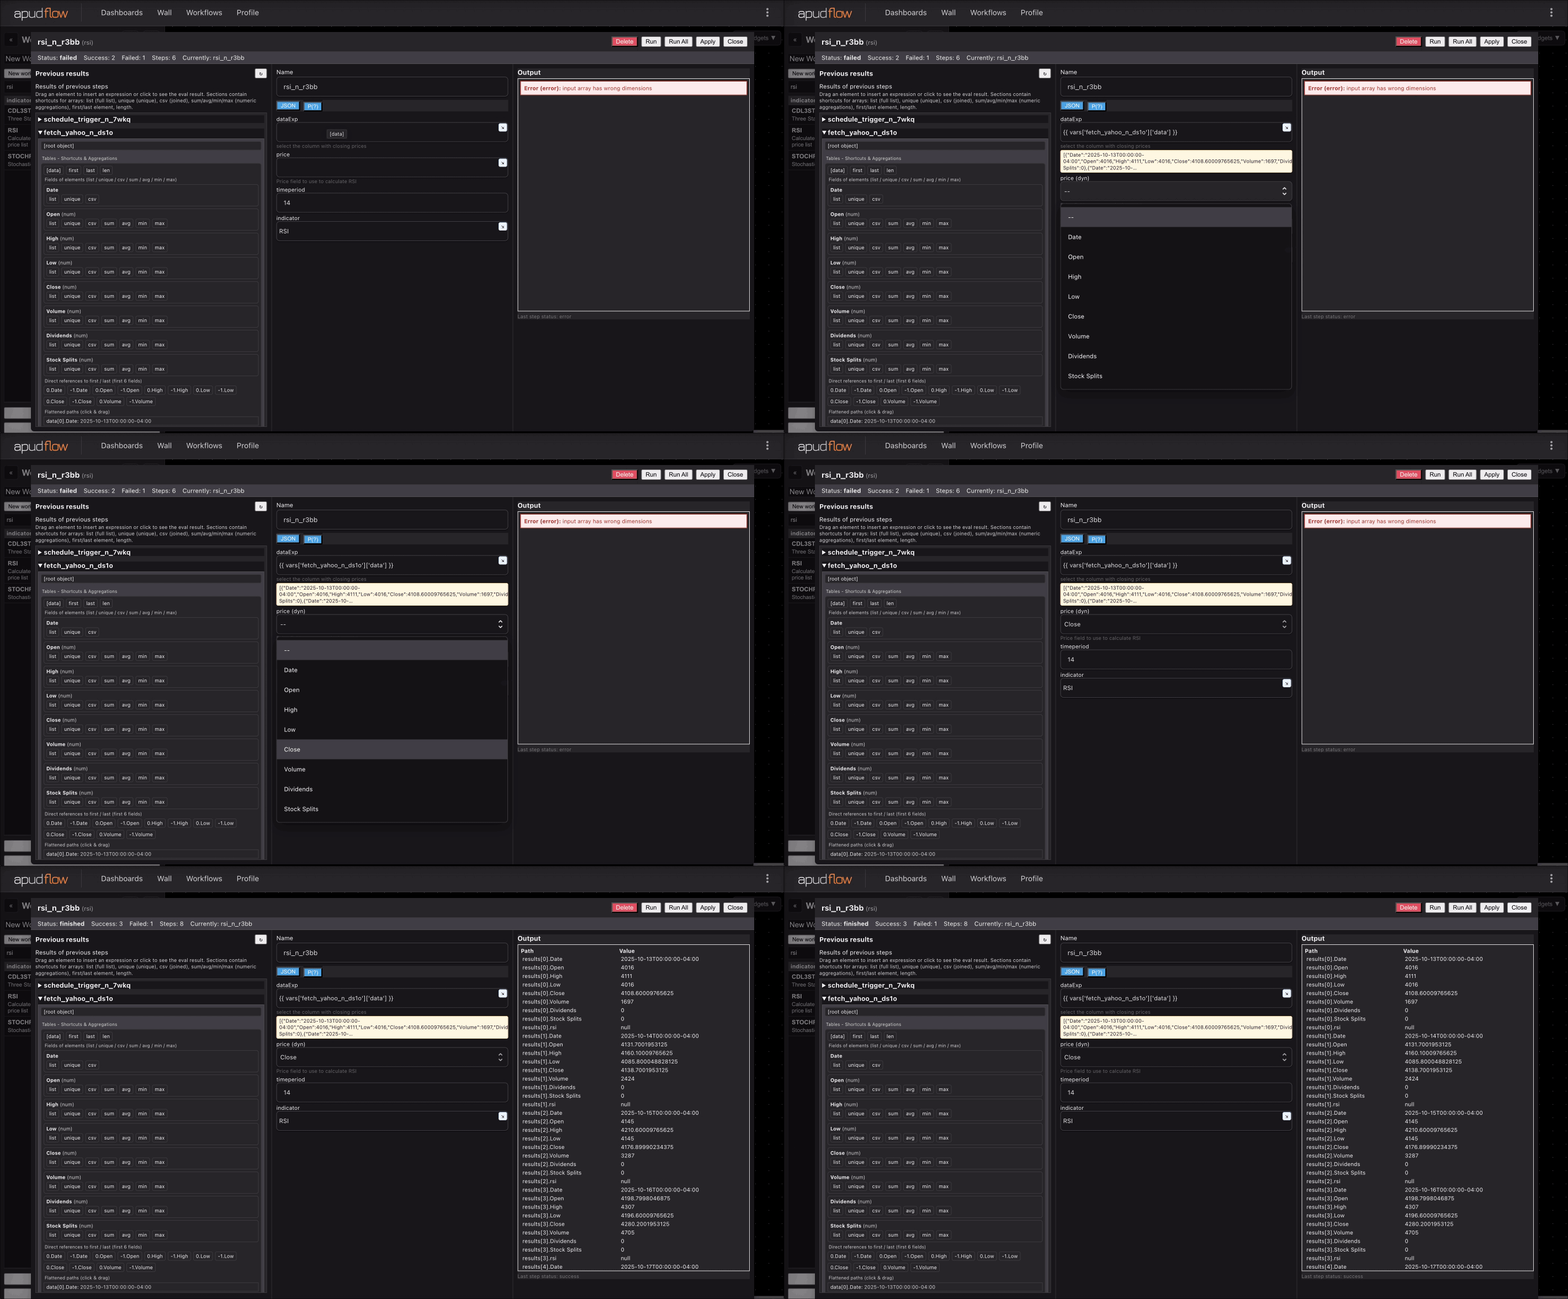
The ADXR indicator can be visualized using a chart. Here is an example of how to use the ADXR indicator:

For a shorter overview:

Additional Information
The ADXR indicator was developed by J. Welles Wilder and is widely used in technical analysis. It is often used in combination with other indicators to confirm trading decisions.
Example Use Cases
- Use the ADXR indicator to confirm trading decisions
- Use the ADXR indicator to identify potential trading opportunities
- Use the ADXR indicator to evaluate the strength of a trend
By following these guidelines and using the ADXR indicator in your trading strategy, you can gain a better understanding of market trends and make more informed trading decisions.