Alpha#68
Type:
alpha_68• Category:indicators
Description
Alpha#68 - ts_rank correlation and delta.
Parameters
| Name | Type | Description | Required | Default |
|---|---|---|---|---|
dataExp | string | price data | no | |
high | string | select the column with highest prices | no | |
volume | string | select the column with volume | no | |
close | string | select the column with closing prices | no | |
low | string | select the column with lowest prices | no |
Help
Alpha#68
Description
Alpha#68 is an indicator from Alpha 101, a set of formulaic alphas used in investing strategies. This indicator calculates the ts_rank correlation and delta.
What does this worker do?
This worker calculates the Alpha#68 indicator, which is based on the ts_rank correlation and delta. It uses price data, high, volume, close, and low prices to compute the indicator.
How to interpret the results
The Alpha#68 indicator can be used to identify potential trading opportunities. A higher value indicates a stronger correlation and delta, while a lower value indicates a weaker correlation and delta.
Parameters
The following parameters are required:
- dataExp:
pandas.DataFrame- Description: Price data
- high:
str- Description: Column name with highest prices
- volume:
str- Description: Column name with volume data
- close:
str- Description: Column name with closing prices
- low:
str- Description: Column name with lowest prices
Usage
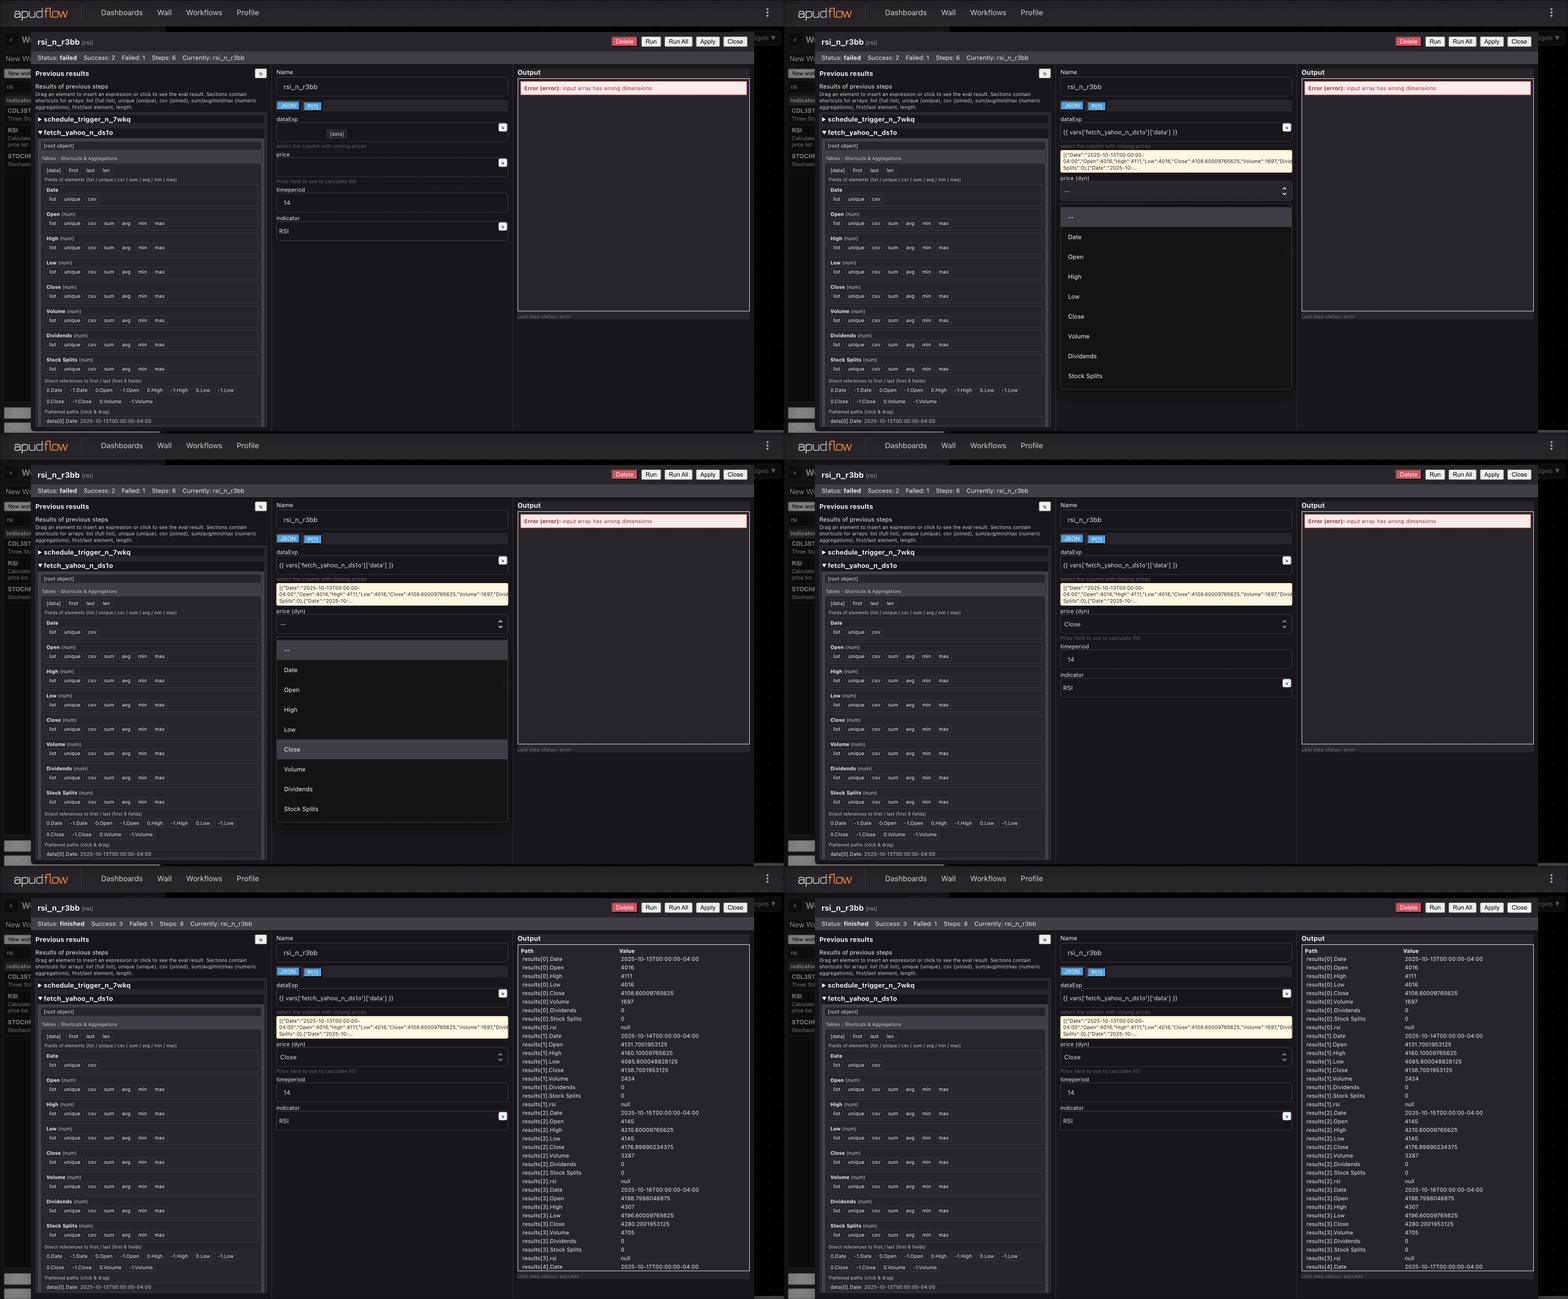
To use this indicator, simply pass in the required parameters. You can refer to the following GIFs for a step-by-step guide:
[](https://pub-6c7cc7f707d94ca98153d59a039b9a3d.r2.dev/indicator_full.gif)
[](https://pub-6c7cc7f707d94ca98153d59a039b9a3d.r2.dev/indicator_short.gif)
Reference
This indicator is based on the research paper 101 Formulaic Alphas by Zura Kakushadze.