Alpha#6
Type:
alpha_6• Category:indicators
Description
Alpha#6 - indicator based on correlation between opening price and volume.
Parameters
| Name | Type | Description | Required | Default |
|---|---|---|---|---|
dataExp | string | price data | no | |
open | string | select the column with opening prices | no | |
volume | string | select the column with volume | no |
Help
Alpha#6
Description
Alpha#6 is an indicator used in investing strategy, specifically in the 101 Formulaic Alphas. This indicator is based on the correlation between the opening price and volume of a stock.
What does this worker do?
This worker calculates the correlation between the opening price and volume of a stock, providing a valuable insight into market trends.
How to interpret the results
The results of this worker can be used to identify potential trading opportunities. A high correlation between the opening price and volume may indicate a strong market trend, while a low correlation may indicate a lack of trend.
Parameters
The following parameters are required to use this worker:
- dataExp: price data
- Type: DataFrame
- Description: The input price data
- open: select the column with opening prices
- Type: string
- Description: The column name of the opening prices in the
dataExpDataFrame
- volume: select the column with volume
- Type: string
- Description: The column name of the volume in the
dataExpDataFrame
Usage
To use this worker, simply provide the required parameters and run the worker. The worker will calculate the correlation between the opening price and volume and return the results.
Visual Guide
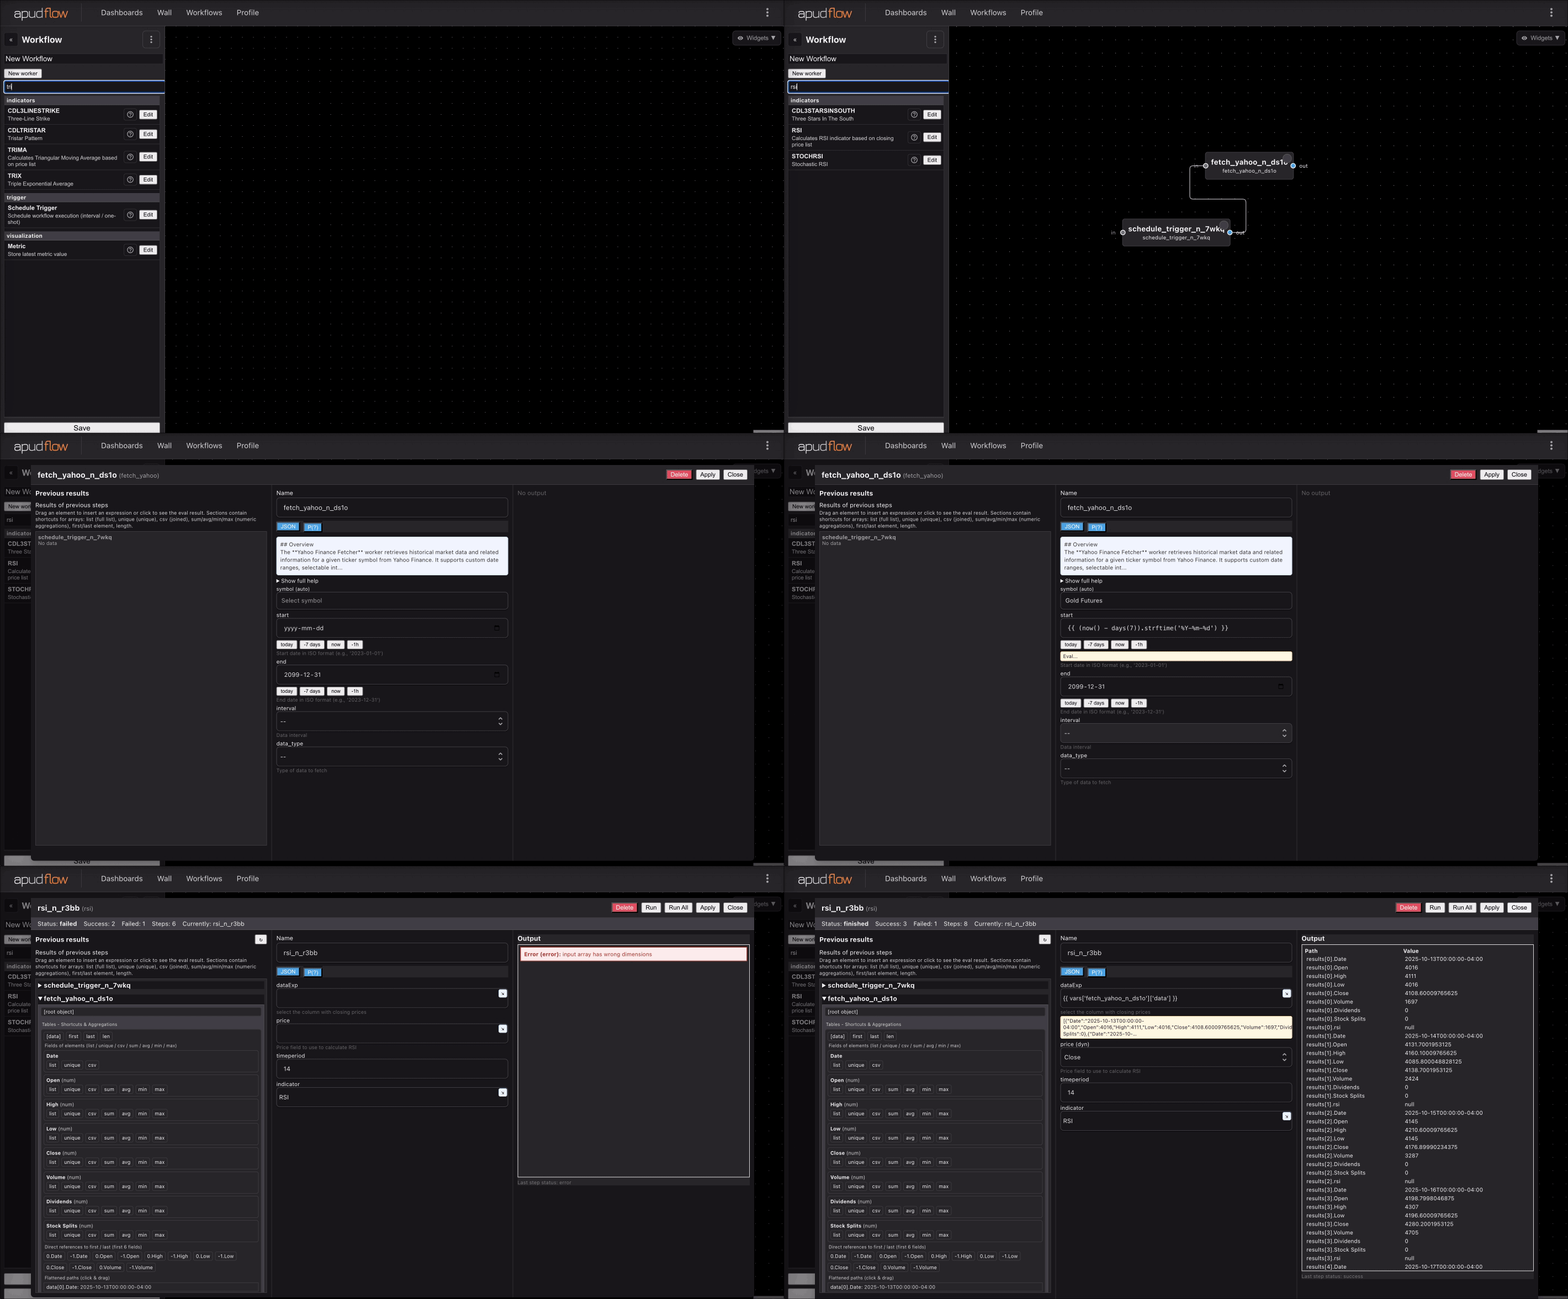
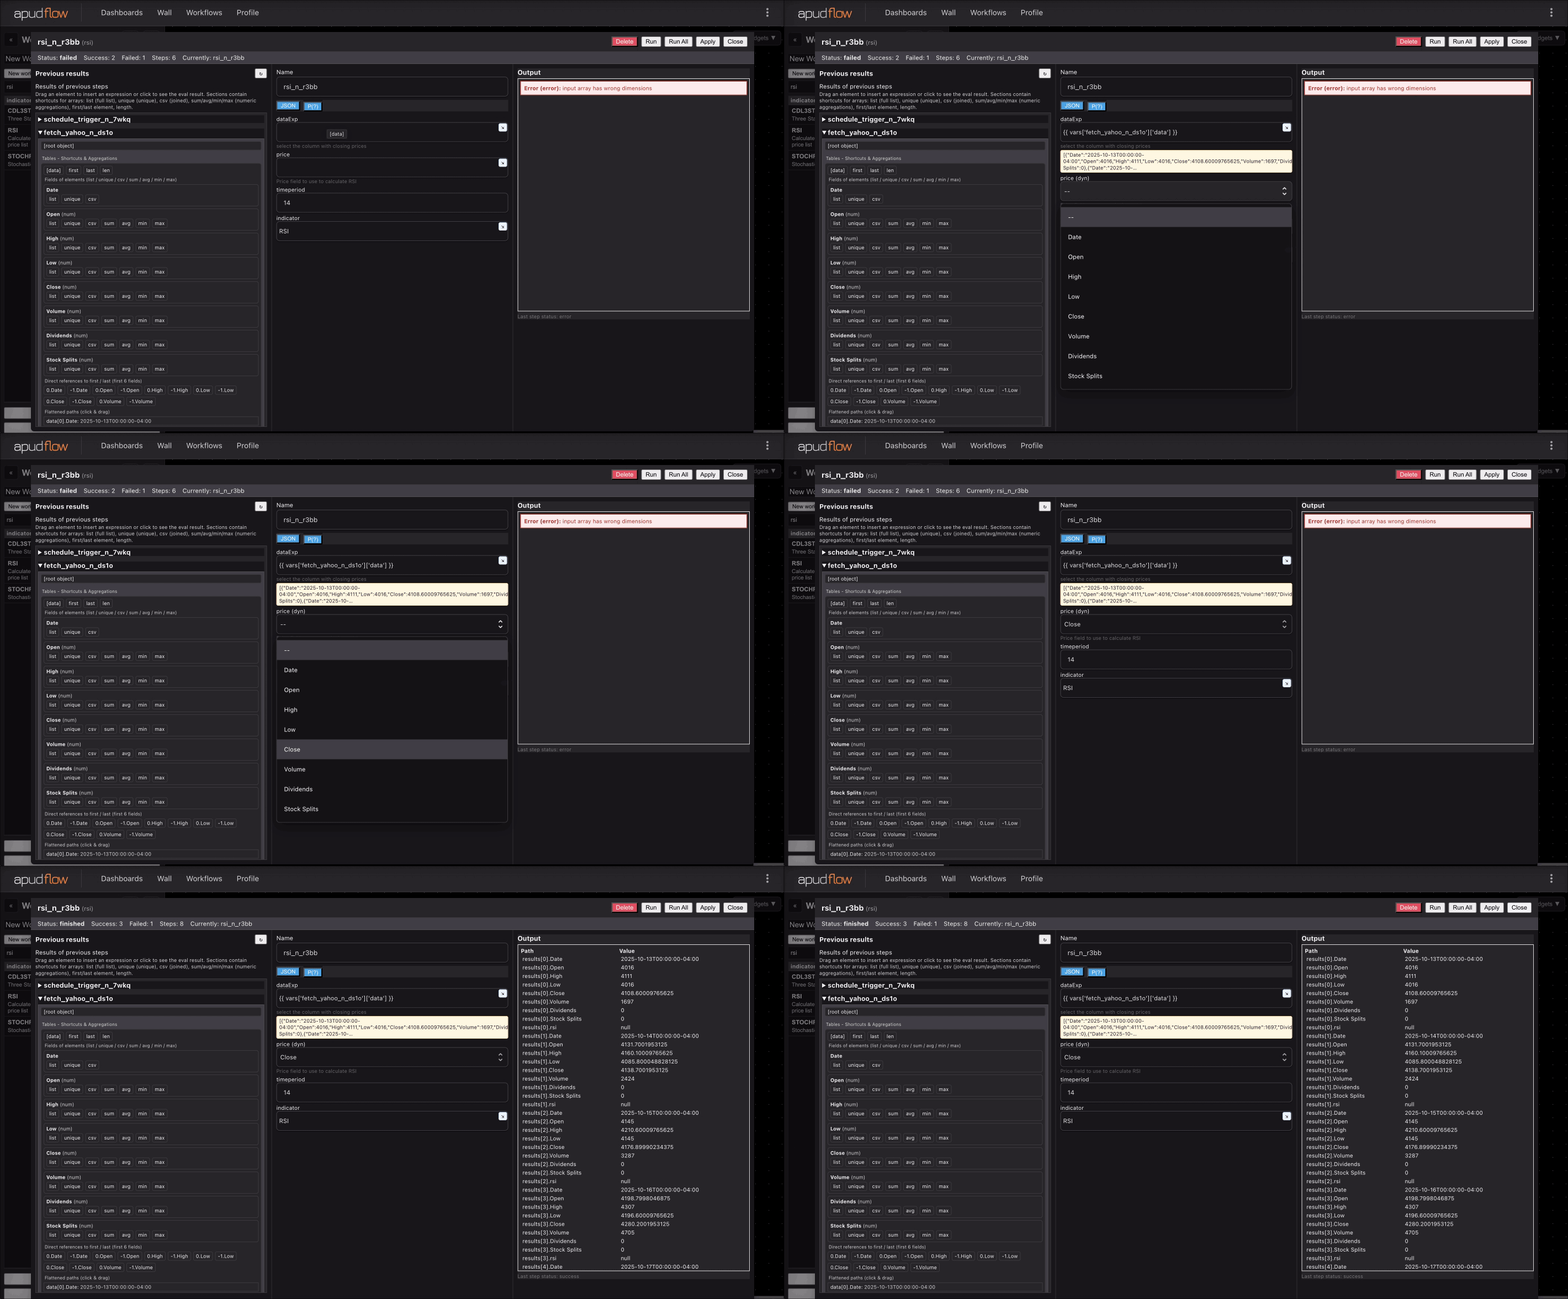
For a visual guide on how to use this worker, please refer to the following GIFs:


Publication
For more information on the 101 Formulaic Alphas, please refer to the publication by Zura Kakushadze:
[101 Formulaic Alphas](https://arxiv.org/pdf/1601.00991.pdf)