Alpha#54
Type:
alpha_54• Category:indicators
Description
Alpha#54 - power ratio indicator.
Parameters
| Name | Type | Description | Required | Default |
|---|---|---|---|---|
dataExp | string | price data | no | |
low | string | select the column with lowest prices | no | |
close | string | select the column with closing prices | no | |
open | string | select the column with opening prices | no | |
high | string | select the column with highest prices | no |
Help
Alpha#54
Description
Alpha#54 is a power ratio indicator used in investing strategies, specifically one of the 101 Formulaic Alphas. This indicator calculates the power ratio of a stock based on its price movements.
What does this worker do?
The Alpha#54 worker calculates the power ratio indicator for a given set of stock prices. The power ratio is a measure of a stock's price movement over a certain period, taking into account the opening, closing, high, and low prices.
How to interpret the results
The power ratio indicator can be used to identify trends and patterns in a stock's price movement. A higher power ratio indicates a stronger trend, while a lower power ratio indicates a weaker trend.
Parameters
The Alpha#54 worker takes the following parameters:
- dataExp: price data
- Description: The input price data.
- low: column with lowest prices
- Description: The column containing the lowest prices.
- close: column with closing prices
- Description: The column containing the closing prices.
- open: column with opening prices
- Description: The column containing the opening prices.
- high: column with highest prices
- Description: The column containing the highest prices.
Usage
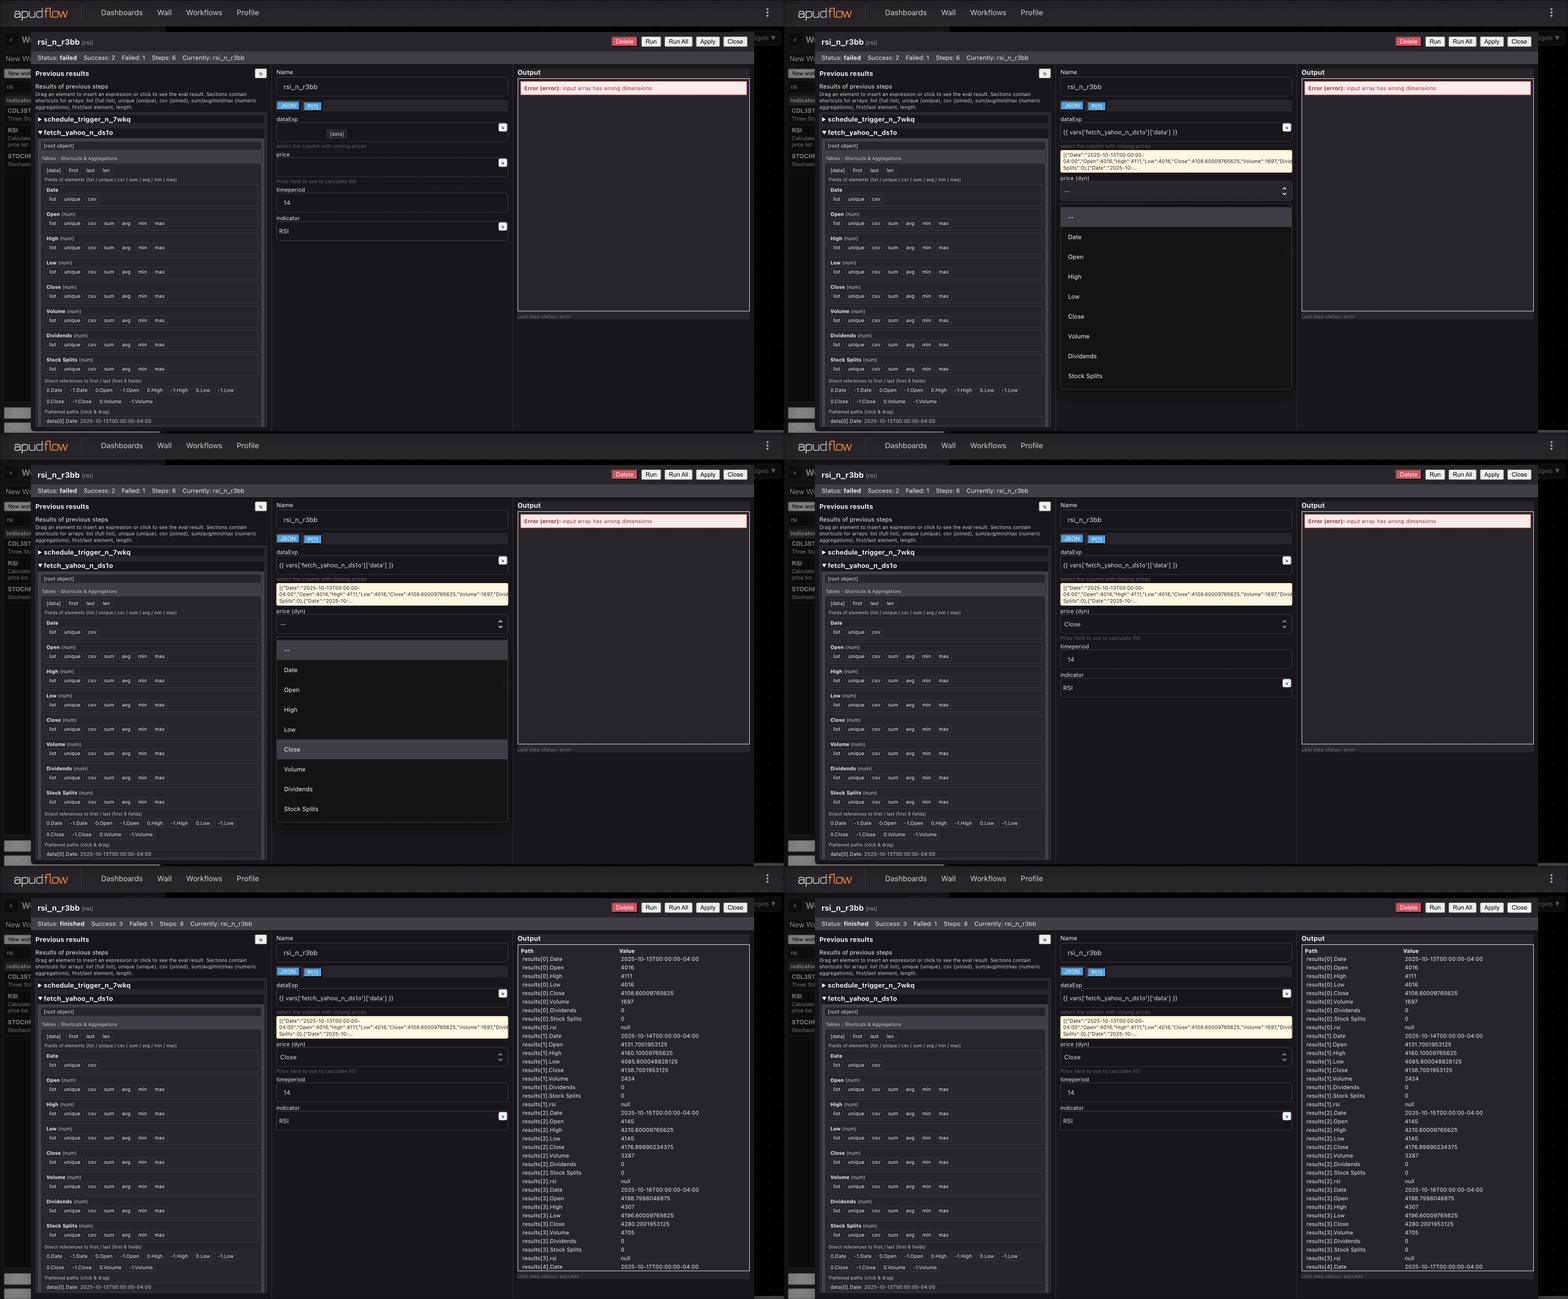
For a visual guide on how to use the Alpha#54 worker, please refer to the following GIFs:


Reference
For more information on the 101 Formulaic Alphas, please refer to the publication by Zura Kakushadze:
[101 Formulaic Alphas](https://arxiv.org/pdf/1601.00991.pdf)