CORREL
Type:
correl• Category:indicators
Description
Współczynnik korelacji Pearsona
Parameters
| Name | Type | Description | Required | Default |
|---|---|---|---|---|
dataExp | string | prices data | no | |
real0 | string | First data series | no | |
real1 | string | Second data series | no | |
timeperiod | number | Number of periods to use for CORREL calculation | no | 30 |
Help
CORREL
Description
The CORREL worker calculates the Pearson correlation coefficient, a measure used in financial analysis to assess the linear relationship between two data series.
What does this worker do?
The CORREL worker takes two data series (real0 and real1) and a time period as input, and returns the Pearson correlation coefficient. This coefficient measures the strength and direction of the linear relationship between the two data series over the specified time period.
How to interpret the results
The Pearson correlation coefficient ranges from -1 to 1.
- A value of 1 indicates a perfect positive linear relationship between the two data series.
- A value of -1 indicates a perfect negative linear relationship between the two data series.
- A value close to 0 indicates no linear relationship between the two data series.
Usage
To use the CORREL worker, simply provide the required parameters:
dataExp: prices datareal0: First data seriesreal1: Second data seriestimeperiod: Number of periods to use for CORREL calculation
Example Use Cases
The CORREL worker can be used in various financial analysis scenarios, such as:
- Analyzing the relationship between two stocks
- Evaluating the correlation between a stock and a market index
- Identifying potential diversification opportunities in a portfolio
Visual Guide
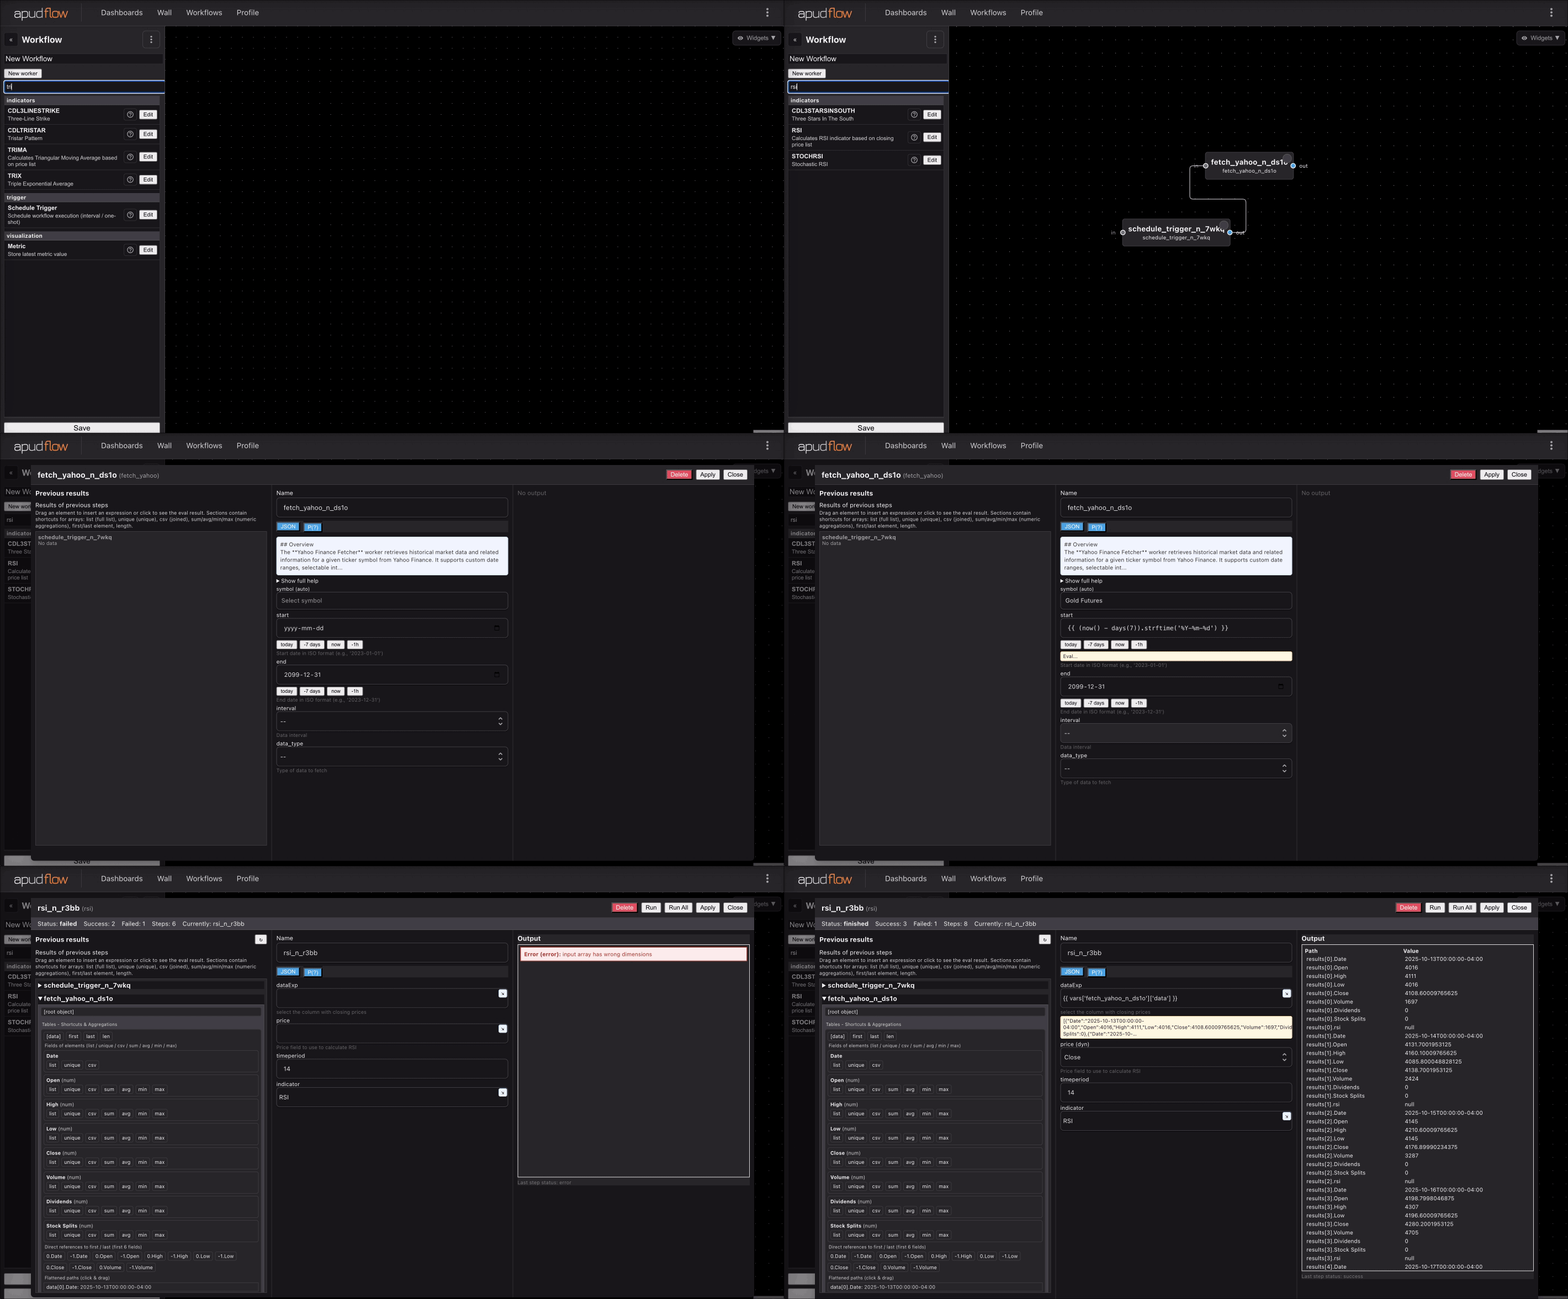
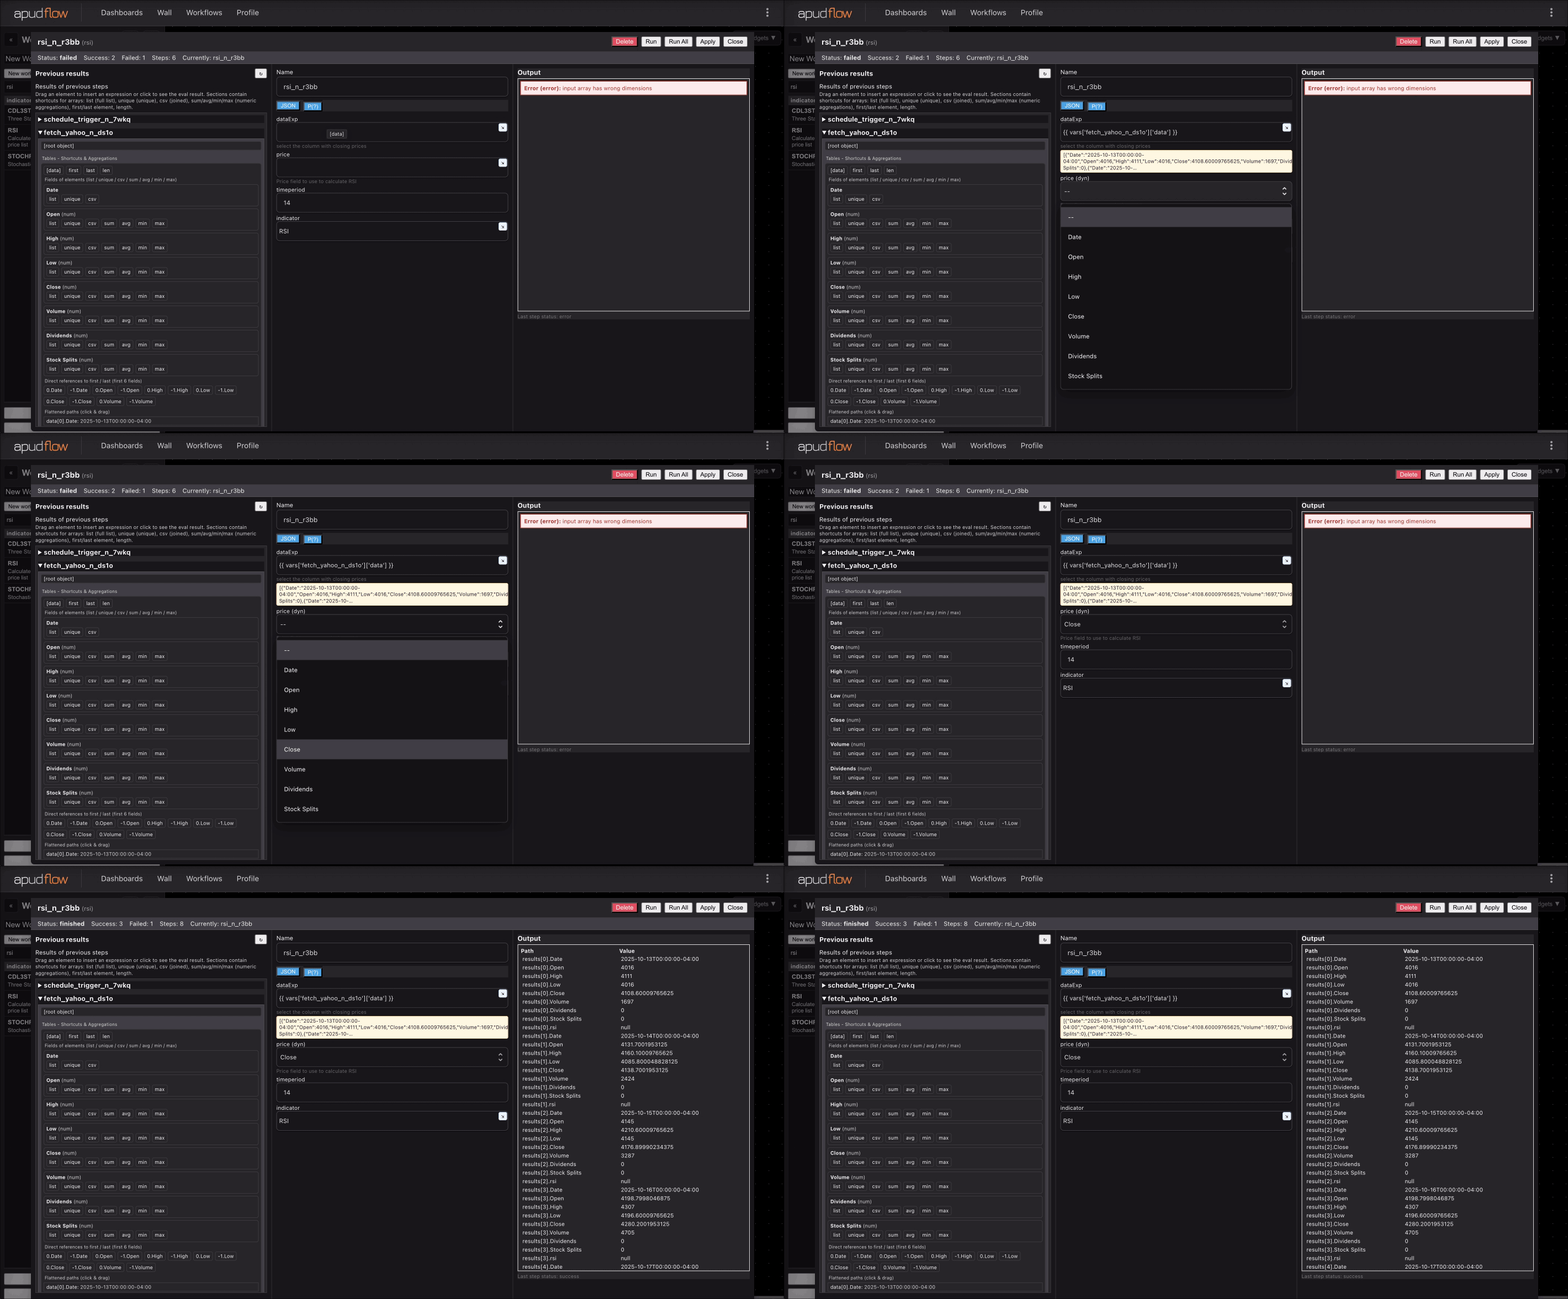
For a step-by-step visual guide on how to use the CORREL worker, please refer to the following GIFs:
Full GIF
[](https://pub-6c7cc7f707d94ca98153d59a039b9a3d.r2.dev/indicator_full.gif)
Short GIF
[](https://pub-6c7cc7f707d94ca98153d59a039b9a3d.r2.dev/indicator_short.gif)
Additional Information
The Pearson correlation coefficient is a widely used statistical measure in finance. However, it is essential to note that correlation does not imply causation. A high correlation between two data series does not necessarily mean that one causes the other. Additionally, the CORREL worker assumes a linear relationship between the data series, which may not always be the case. Therefore, it is crucial to consider other factors and perform further analysis when interpreting the results.