LINEARREG_SLOPE
Type:
linearreg_slope• Category:indicators
Description
Linear Regression Slope
Parameters
| Name | Type | Description | Required | Default |
|---|---|---|---|---|
dataExp | string | prices data | no | |
real | string | Data column to apply the calculation to (e.g., closing price) | no | |
timeperiod | number | Number of periods to use for LINEARREG_SLOPE calculation | no | 14 |
Help
LINEARREG_SLOPE
Description
The LINEARREG_SLOPE worker is a financial analysis indicator used to calculate the slope of a linear regression line. It helps in understanding the rate of change of a specific data point (e.g., closing price) over a defined period.
What does this worker do?
The LINEARREG_SLOPE worker calculates the slope of a linear regression line for a specified data column (e.g., closing price) over a defined number of periods (timeperiod). This slope represents the rate of change of the data point over the specified period.
How to interpret the results
The LINEARREG_SLOPE value represents the rate of change of the data point. A positive value indicates an upward trend, while a negative value indicates a downward trend. The magnitude of the value represents the steepness of the trend.
Usage
To use the LINEARREG_SLOPE worker, simply provide the following parameters:
dataExp: prices datareal: Data column to apply the calculation to (e.g., closing price)timeperiod: Number of periods to use for LINEARREG_SLOPE calculation
Indicator Usage Example
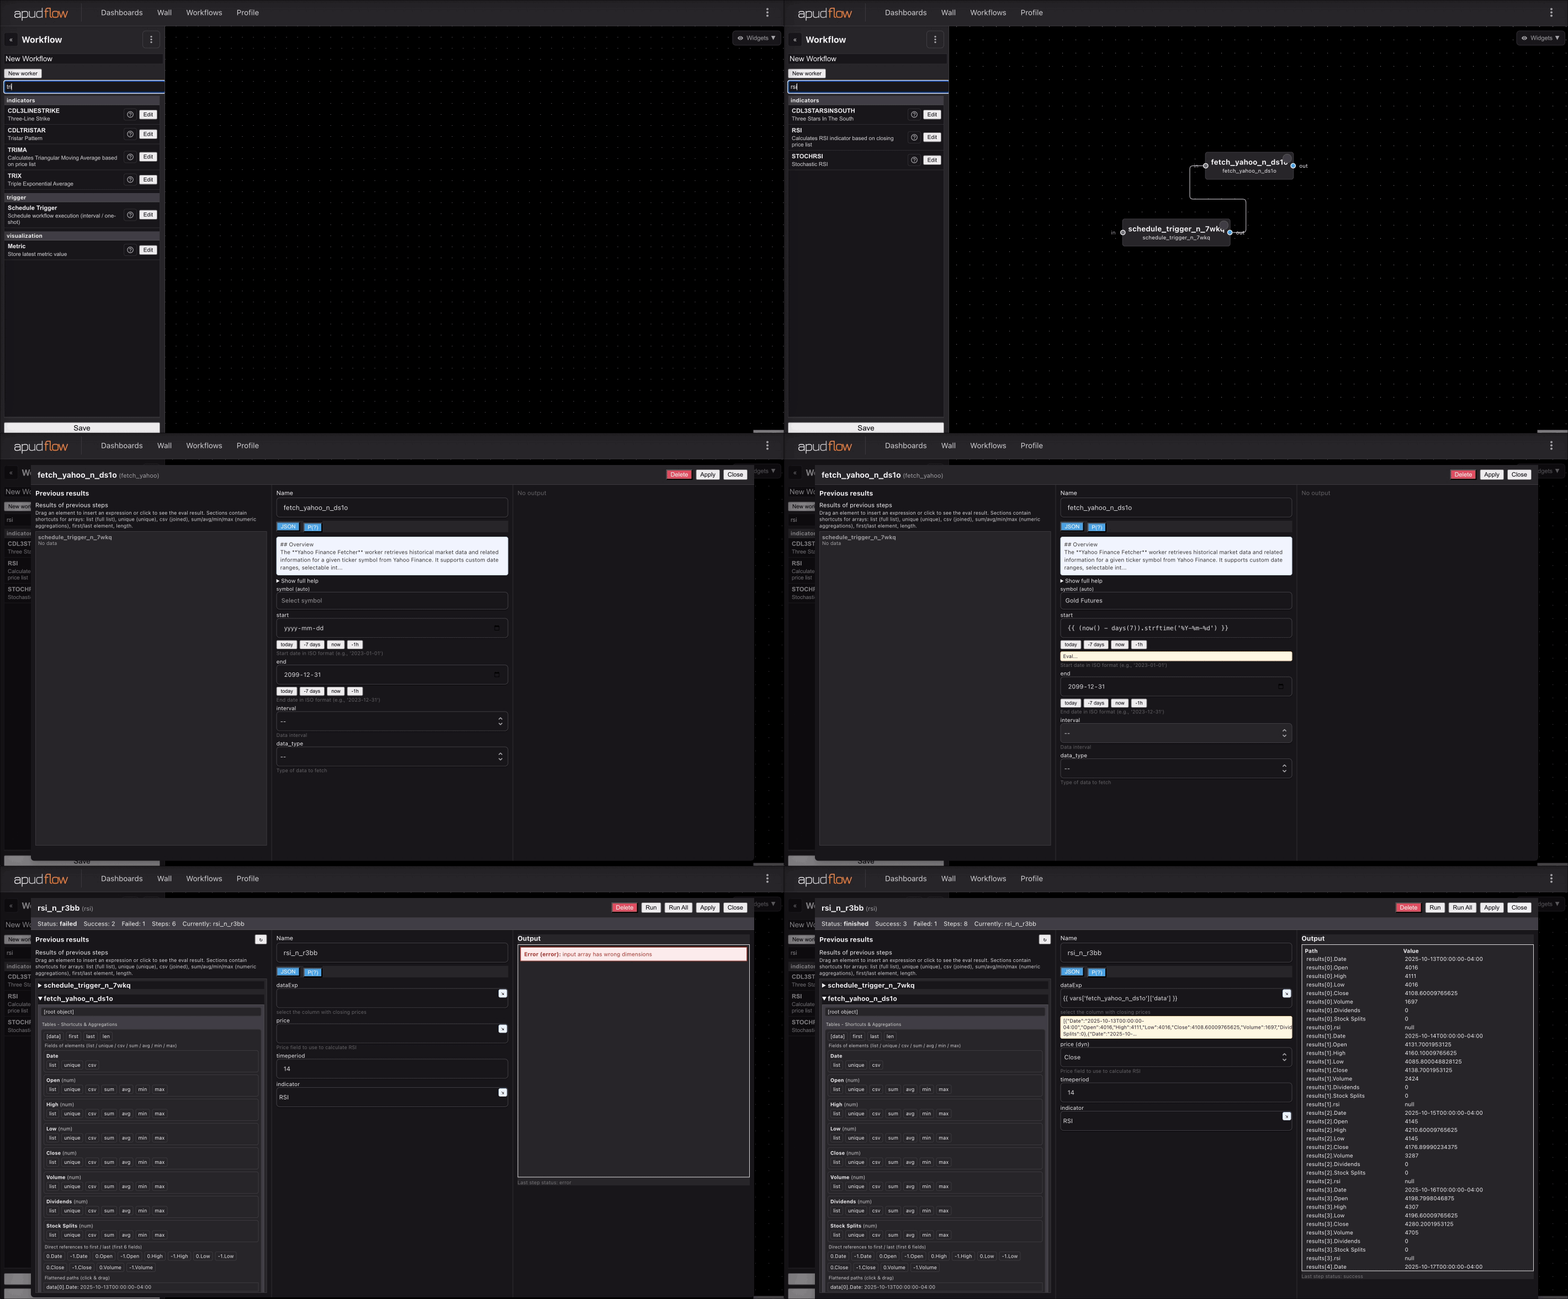
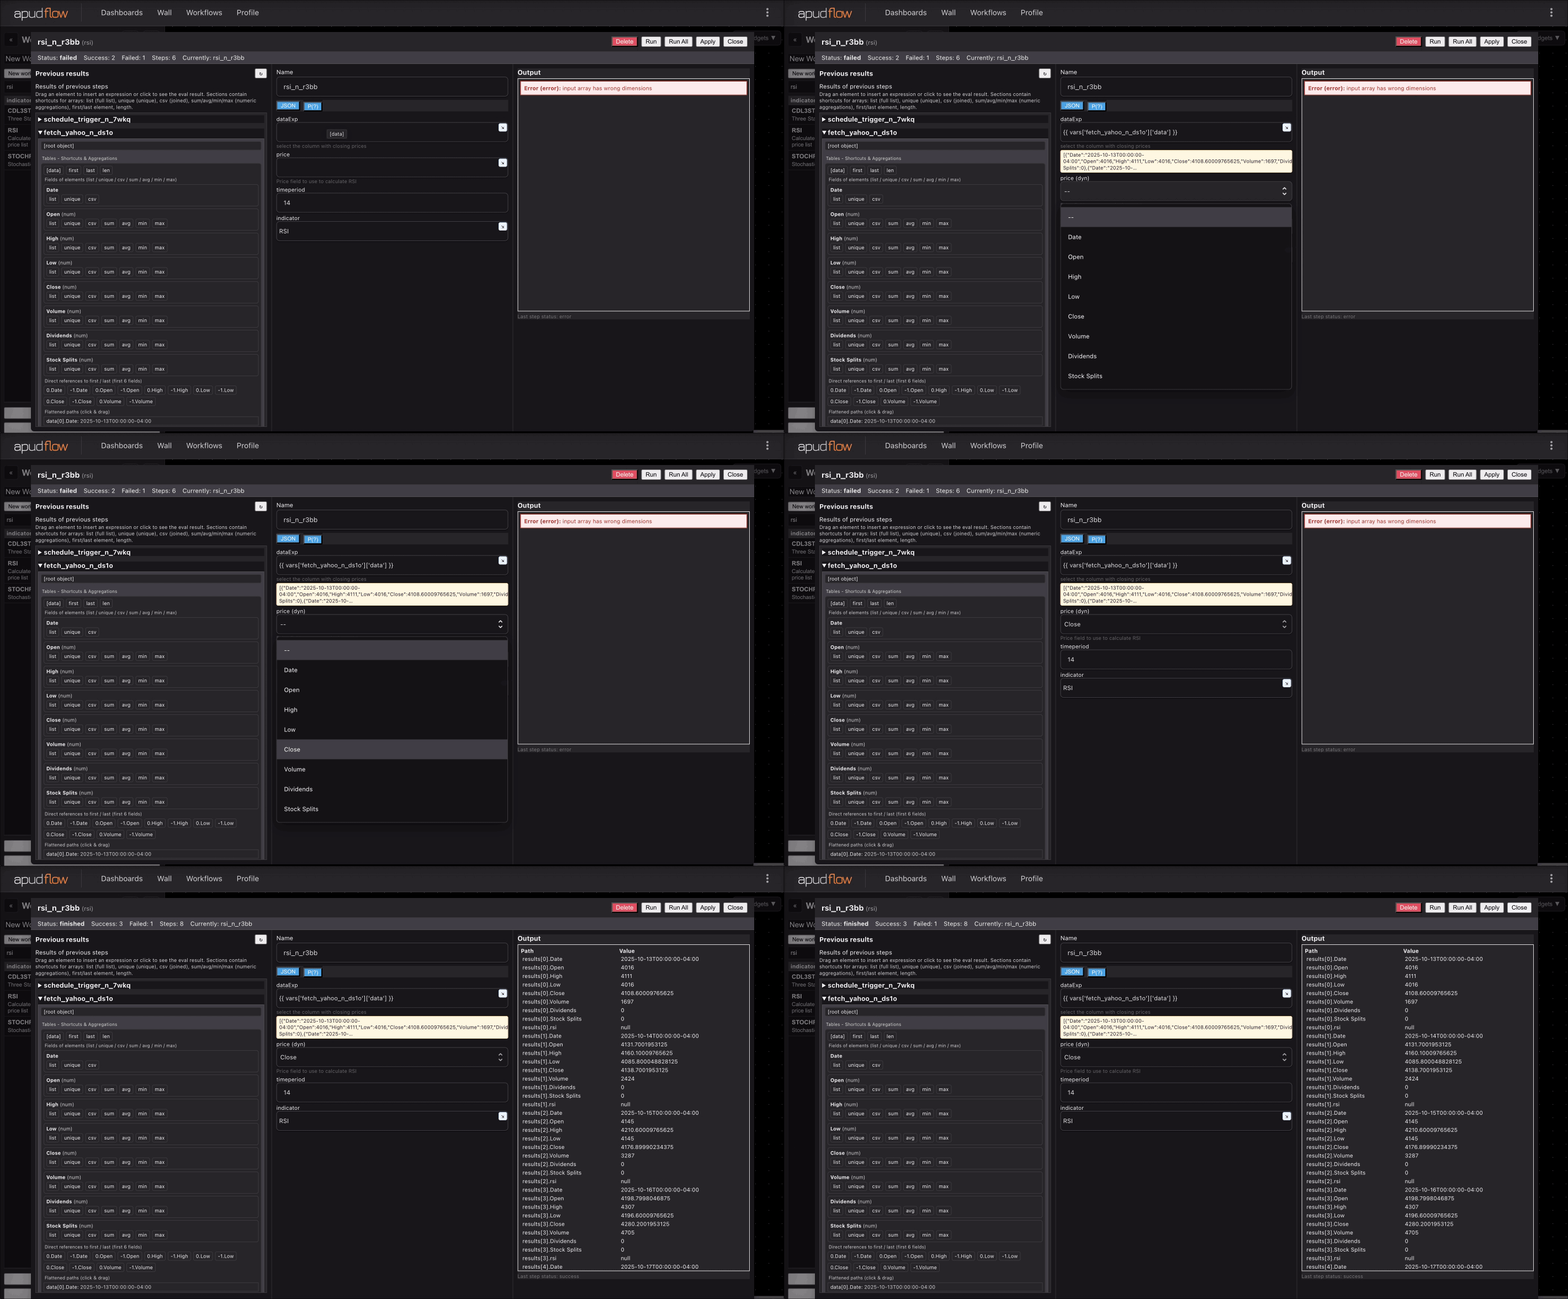
For a better understanding of how to use the LINEARREG_SLOPE worker, refer to the following GIFs:
Full Indicator Usage Example
[](https://pub-6c7cc7f707d94ca98153d59a039b9a3d.r2.dev/indicator_full.gif)
Short Indicator Usage Example
[](https://pub-6c7cc7f707d94ca98153d59a039b9a3d.r2.dev/indicator_short.gif)
Additional Information
The LINEARREG_SLOPE indicator is commonly used in technical analysis to identify trends and predict future price movements. A rising LINEARREG_SLOPE value indicates an increasing rate of change, which can be a sign of a strong uptrend. Conversely, a falling LINEARREG_SLOPE value indicates a decreasing rate of change, which can be a sign of a strong downtrend.
By incorporating the LINEARREG_SLOPE worker into your financial analysis, you can gain valuable insights into market trends and make more informed investment decisions.