STOCHRSI
Type:
stochrsi• Category:indicators
Description
Stochastic RSI
Parameters
| Name | Type | Description | Required | Default |
|---|---|---|---|---|
dataExp | string | prices data | no | |
price | string | Price field to use to calculate STOCHRSI | no | |
timeperiod | number | Number of periods to use for STOCHRSI calculation | no | 14 |
fastk_period | number | Fast %K period | no | 5 |
fastd_period | number | Fast %D period | no | 3 |
fastd_matype | number | Fast %D moving average type | no | 0 |
Help
STOCHRSI
Stochastic RSI
The STOCHRSI is an indicator used in financial analysis to gauge the level of the RSI (Relative Strength Index) relative to its own past performance over a given period. It combines the features of the Stochastic Oscillator and the RSI, providing insights into whether an asset is overbought or oversold.
Description
The Stochastic RSI (STOCHRSI) is a technical analysis indicator that applies the Stochastic Oscillator formula to the RSI. The RSI measures the magnitude of recent price changes to determine overbought or oversold conditions. The Stochastic Oscillator, on the other hand, compares the closing price of a security to its price range over a given period. By combining these two, the STOCHRSI offers a more nuanced view of market conditions.
What does this worker do?
The STOCHRSI worker calculates the Stochastic RSI for a given set of price data. It takes the following parameters:
dataExp: The price data to analyze.price: The price field to use for the calculation.timeperiod: The number of periods to use for the STOCHRSI calculation.fastk_period: The period for the Fast %K calculation.fastd_period: The period for the Fast %D calculation.fastd_matype: The moving average type for the Fast %D calculation.
How to Interpret the Results
The STOCHRSI values range from 0 to 100. A reading of:
- 0-20 indicates oversold conditions, suggesting a potential buying opportunity.
- 80-100 indicates overbought conditions, suggesting a potential selling opportunity.
Traders often look for crossovers between the Fast %K and Fast %D lines. A bullish signal occurs when the Fast %K line crosses above the Fast %D line in oversold territory. Conversely, a bearish signal occurs when the Fast %K line crosses below the Fast %D line in overbought territory.
Usage Example
To use the STOCHRSI worker, simply provide the required parameters and execute the worker. The output will include the STOCHRSI values, which can then be used to inform trading decisions.
Visualizing the Indicator
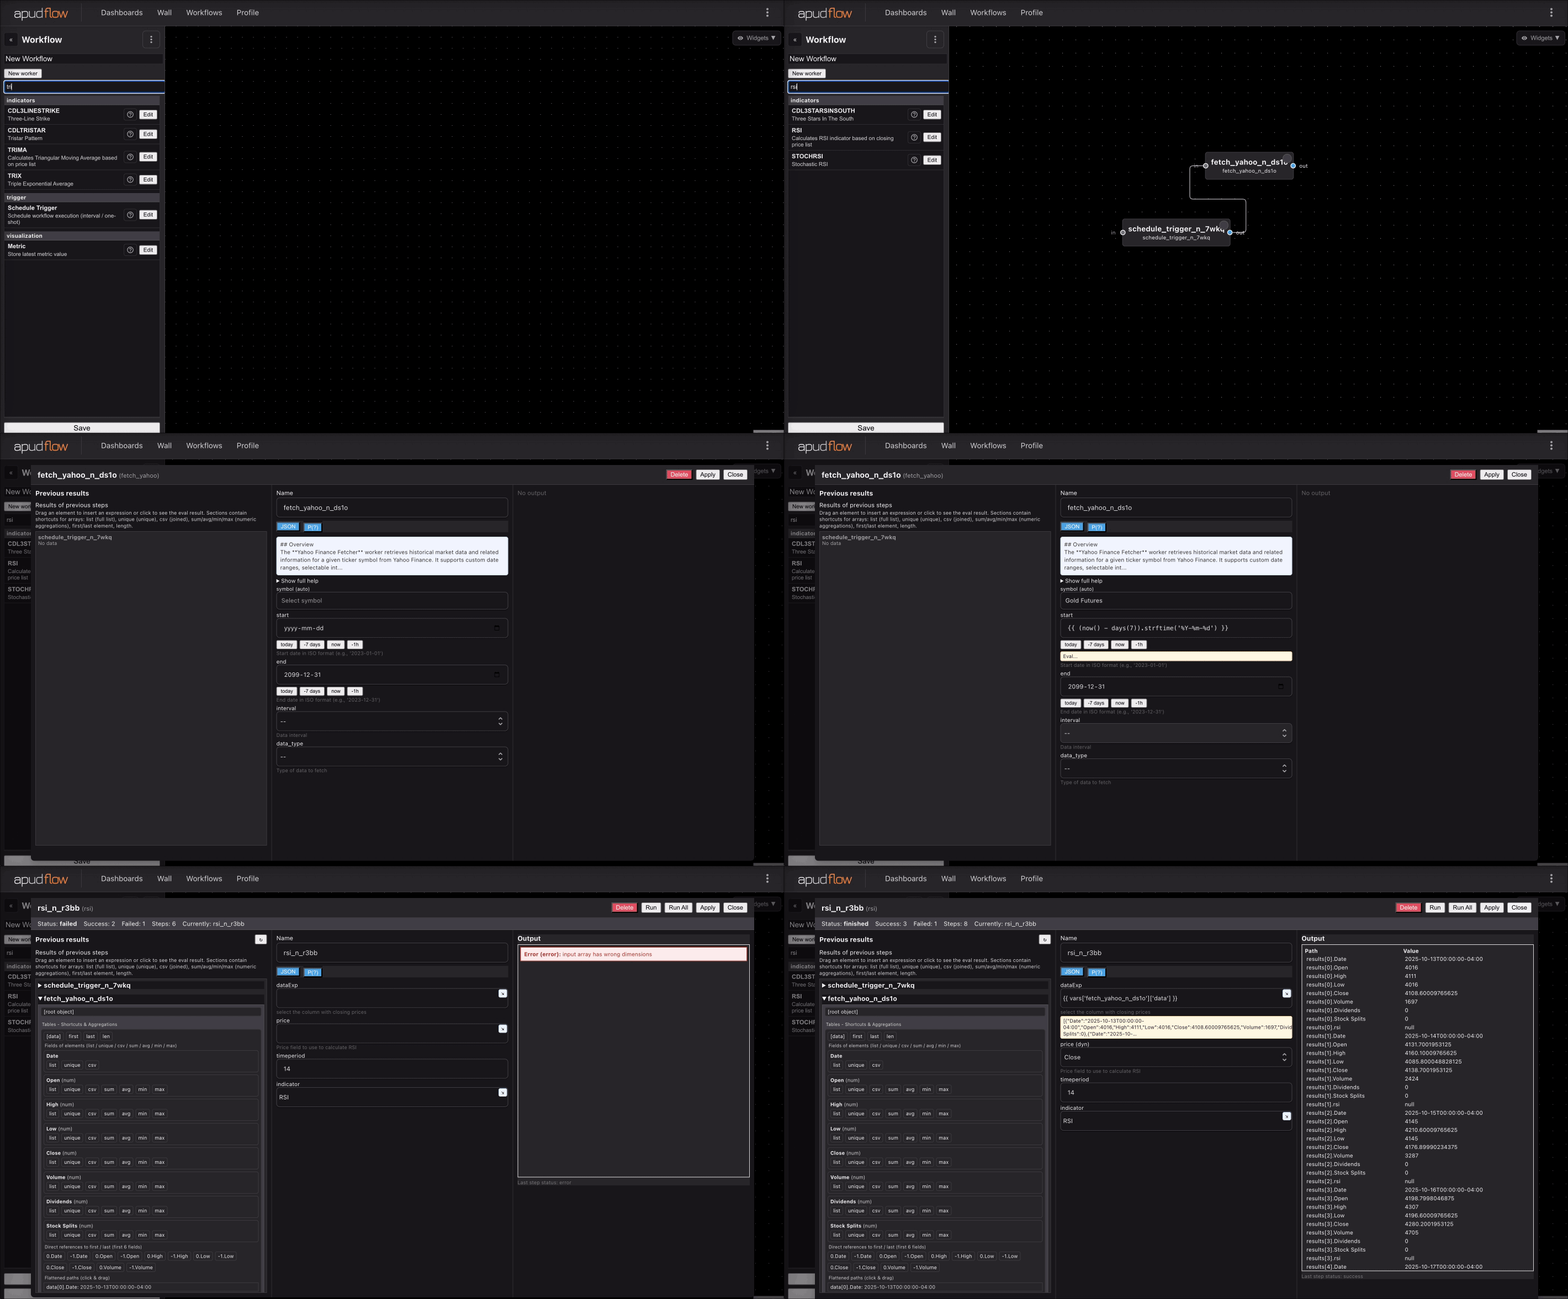
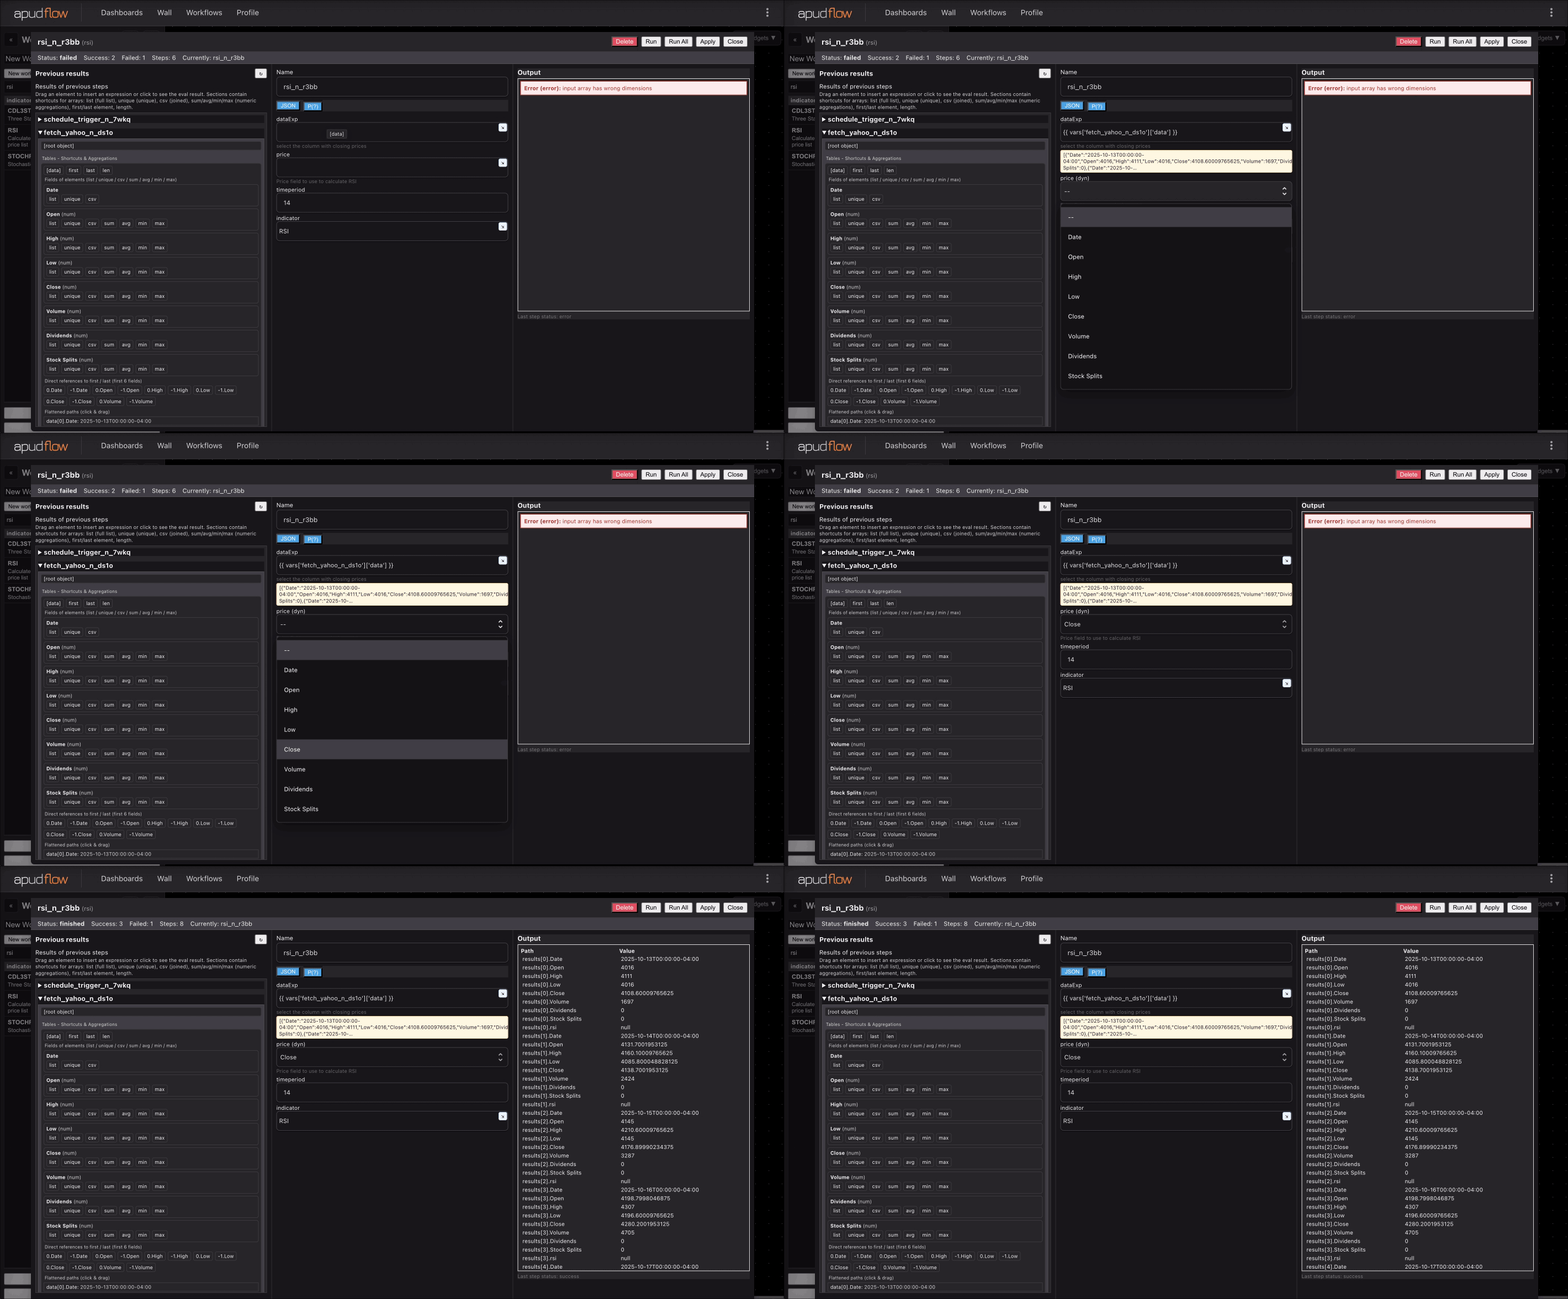
For a visual representation of how to use the STOCHRSI indicator, refer to the following images:
Full Indicator Usage
[](https://pub-6c7cc7f707d94ca98153d59a039b9a3d.r2.dev/indicator_full.gif)
Short Indicator Usage
[](https://pub-6c7cc7f707d94ca98153d59a039b9a3d.r2.dev/indicator_short.gif)
These images provide a step-by-step guide on applying the STOCHRSI indicator in a real-world trading scenario.
Additional Knowledge
The STOCHRSI is particularly useful in volatile markets where the RSI may not provide clear signals. By applying the Stochastic Oscillator to the RSI, traders can gain a better understanding of the market's momentum and make more informed decisions. However, as with any technical indicator, it is essential to use the STOCHRSI in conjunction with other forms of analysis and risk management techniques to maximize its effectiveness.