TEMA
Type:
tema• Category:indicators
Description
Calculates Triple Exponential Moving Average based on price list
Parameters
| Name | Type | Description | Required | Default |
|---|---|---|---|---|
dataExp | string | prices data | no | |
price | string | Price field to use to calculate TEMA | no | |
timeperiod | number | Number of periods to use for TEMA calculation | no | 30 |
indicator | string | no | "TEMA" |
Help
TEMA (Triple Exponential Moving Average)
Description
The TEMA worker is a financial analysis tool used to calculate the Triple Exponential Moving Average of a given price list. This indicator helps smooth out price data by creating a constantly updated average price.
The TEMA is a unique moving average that uses three EMAs (Exponential Moving Averages) to provide a more accurate and responsive average. It is often used to identify trends and provide a smoother representation of price action.
What does this worker do?
The TEMA worker takes in a list of prices and calculates the Triple Exponential Moving Average based on a specified time period. The result is a smoothed-out price line that can be used to analyze trends and make informed investment decisions.
How to interpret the results
The TEMA indicator can be interpreted in several ways:
- When the TEMA line is above the price line, it indicates a bullish trend.
- When the TEMA line is below the price line, it indicates a bearish trend.
- Crossovers between the TEMA line and the price line can signal potential buy or sell opportunities.
Using the TEMA worker
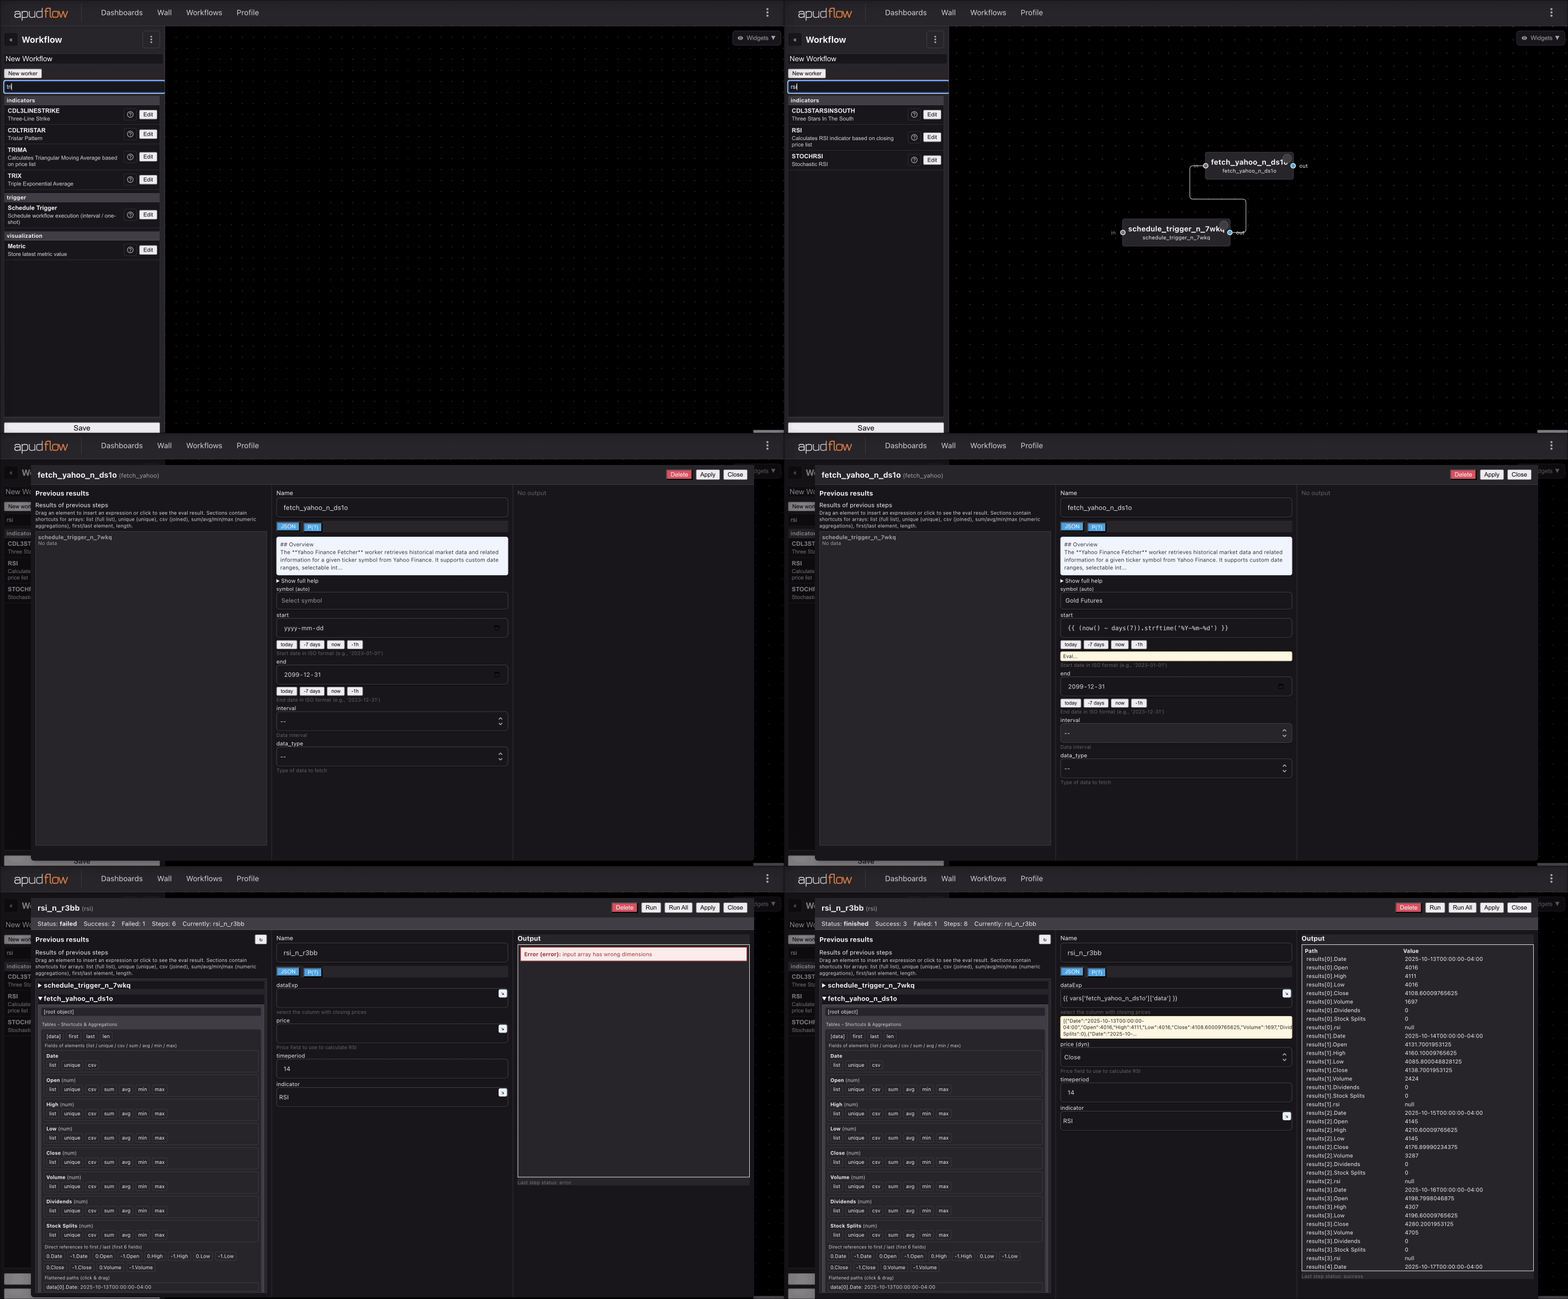
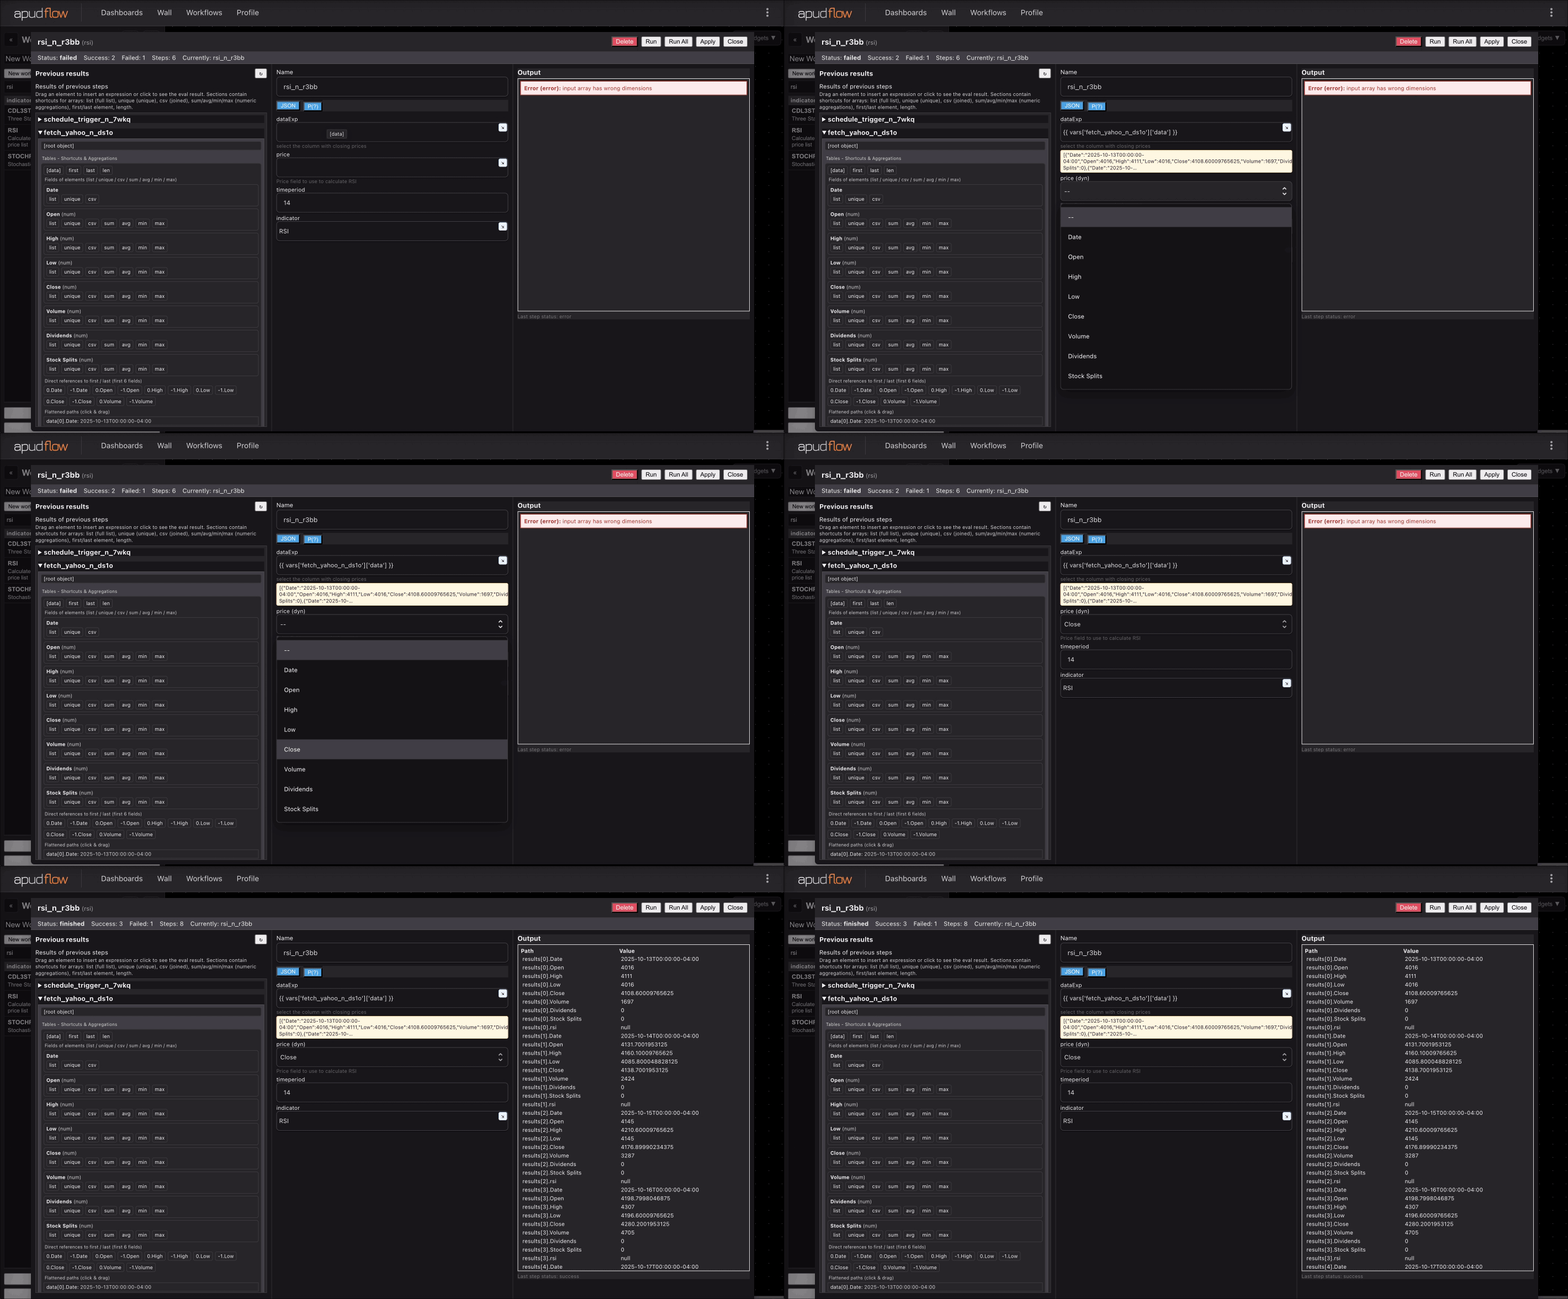
To use the TEMA worker, simply provide the required parameters:
dataExp: prices dataprice: Price field to use to calculate TEMAtimeperiod: Number of periods to use for TEMA calculationindicator: No description
Example Use Cases
The TEMA worker can be used in a variety of financial analysis scenarios, such as:
- Identifying trends in stock prices
- Smoothing out volatile price data
- Creating trading strategies based on TEMA crossovers
Visualizing the TEMA worker
For a visual representation of how to use the TEMA worker, see the following GIFs:
Full GIF
[](https://pub-6c7cc7f707d94ca98153d59a039b9a3d.r2.dev/indicator_full.gif)
Short GIF
[](https://pub-6c7cc7f707d94ca98153d59a039b9a3d.r2.dev/indicator_short.gif)
Additional Information
The Triple Exponential Moving Average was developed by Mark Douglas, a well-known technical analyst. It is considered a more responsive and accurate moving average compared to traditional EMAs and SMAs (Simple Moving Averages). The TEMA worker provides a valuable tool for financial analysis and can be used in a variety of trading strategies.