Alpha#52
Type:
alpha_52• Category:indicators
Description
Alpha#52 - complex ts_min and ranking.
Parameters
| Name | Type | Description | Required | Default |
|---|---|---|---|---|
dataExp | string | price data | no | |
low | string | select the column with lowest prices | no | |
returns | string | List of returns | no | |
volume | string | select the column with volume | no |
Help
Alpha#52
Description
Alpha#52 is a complex indicator from Alpha 101, a set of formulaic alphas used in investing strategies. This indicator combines time series minimum (ts_min) and ranking to generate a signal.
What does this worker do?
This worker calculates the Alpha#52 indicator using the provided parameters. The indicator is designed to capture complex relationships between price movements, volume, and returns.
How to interpret the results
The output of this worker is a signal that can be used in an investing strategy. A higher signal value may indicate a stronger buy or sell signal, but the exact interpretation depends on the specific strategy and market conditions.
Parameters
The following parameters are required to calculate the Alpha#52 indicator:
- dataExp:
price data- Type: pandas.DataFrame
- Description: Price data used to calculate the indicator
- low:
select the column with lowest prices- Type: str
- Description: Column name in
dataExpwith the lowest prices
- returns:
List of returns- Type: list
- Description: List of returns used to calculate the indicator
- volume:
select the column with volume- Type: str
- Description: Column name in
dataExpwith the volume data
Usage
To use this worker, simply provide the required parameters and run the calculation. The output will be a signal that can be used in your investing strategy.
Visualizing the Indicator
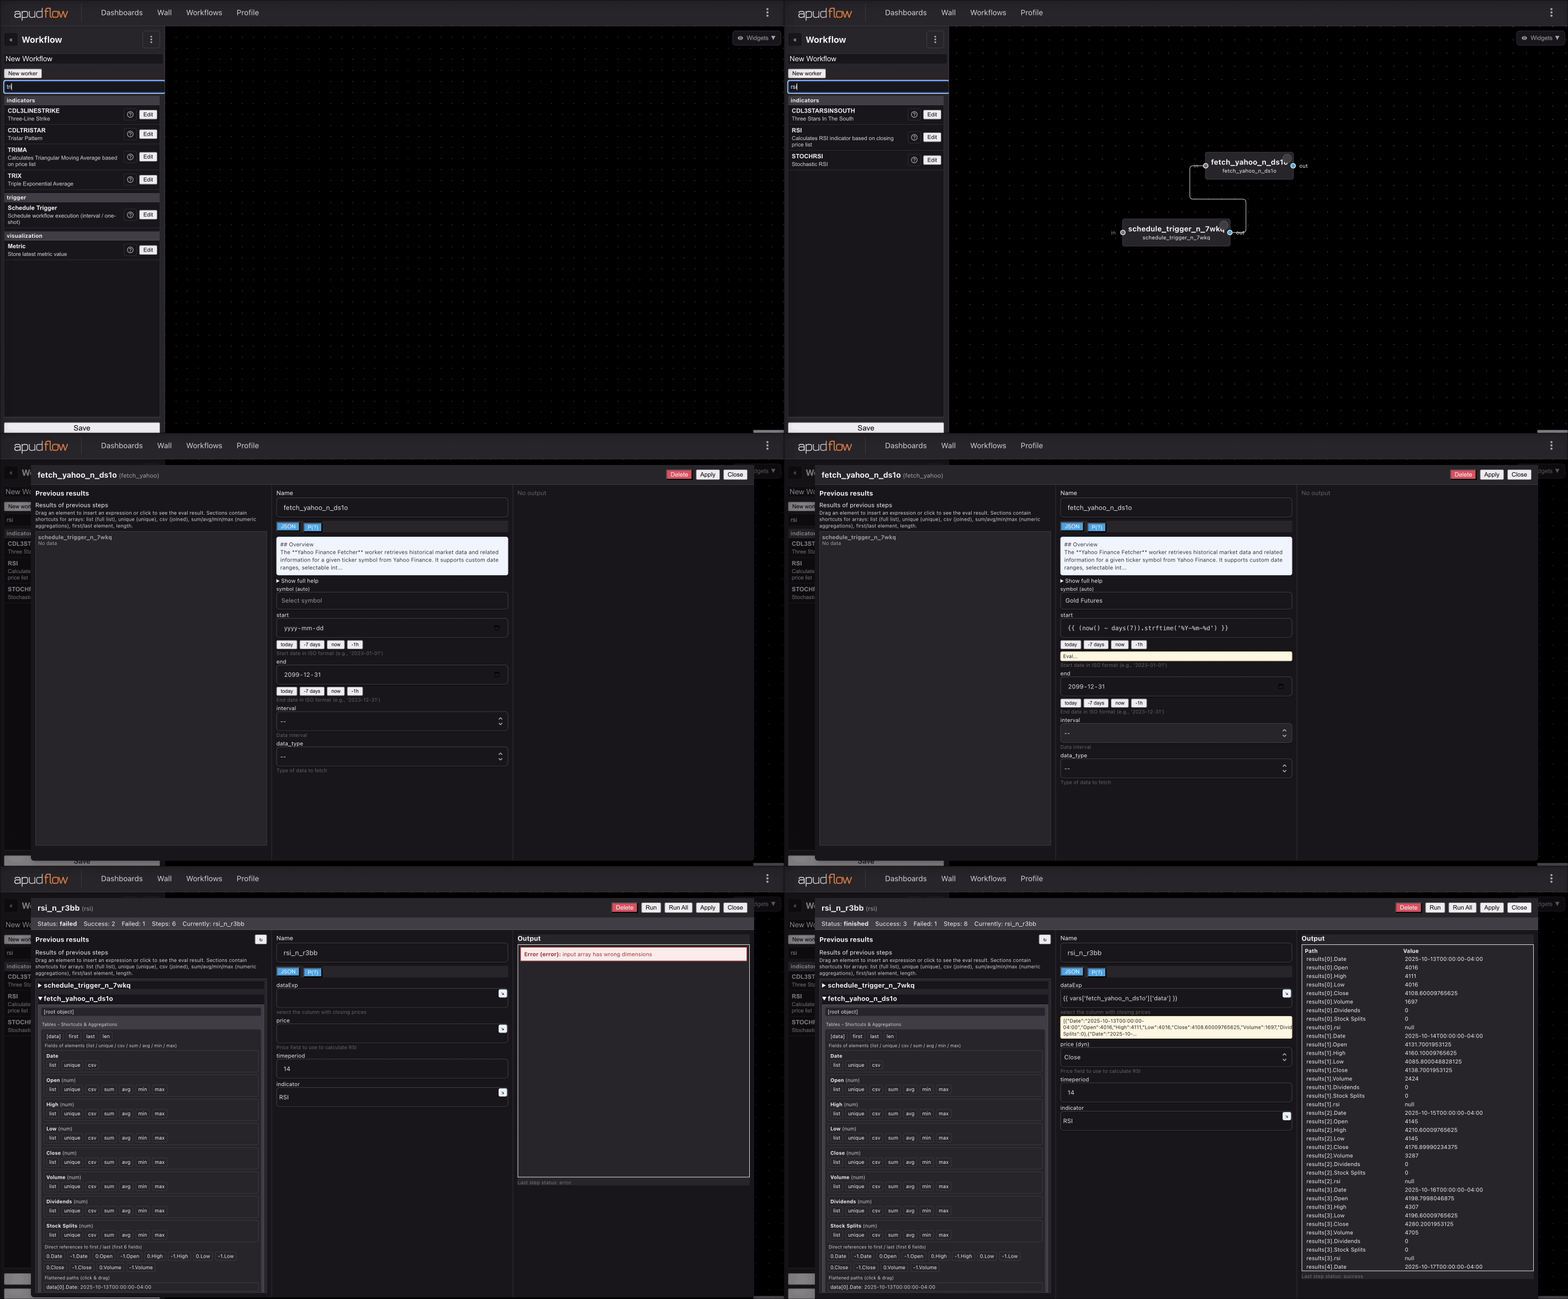
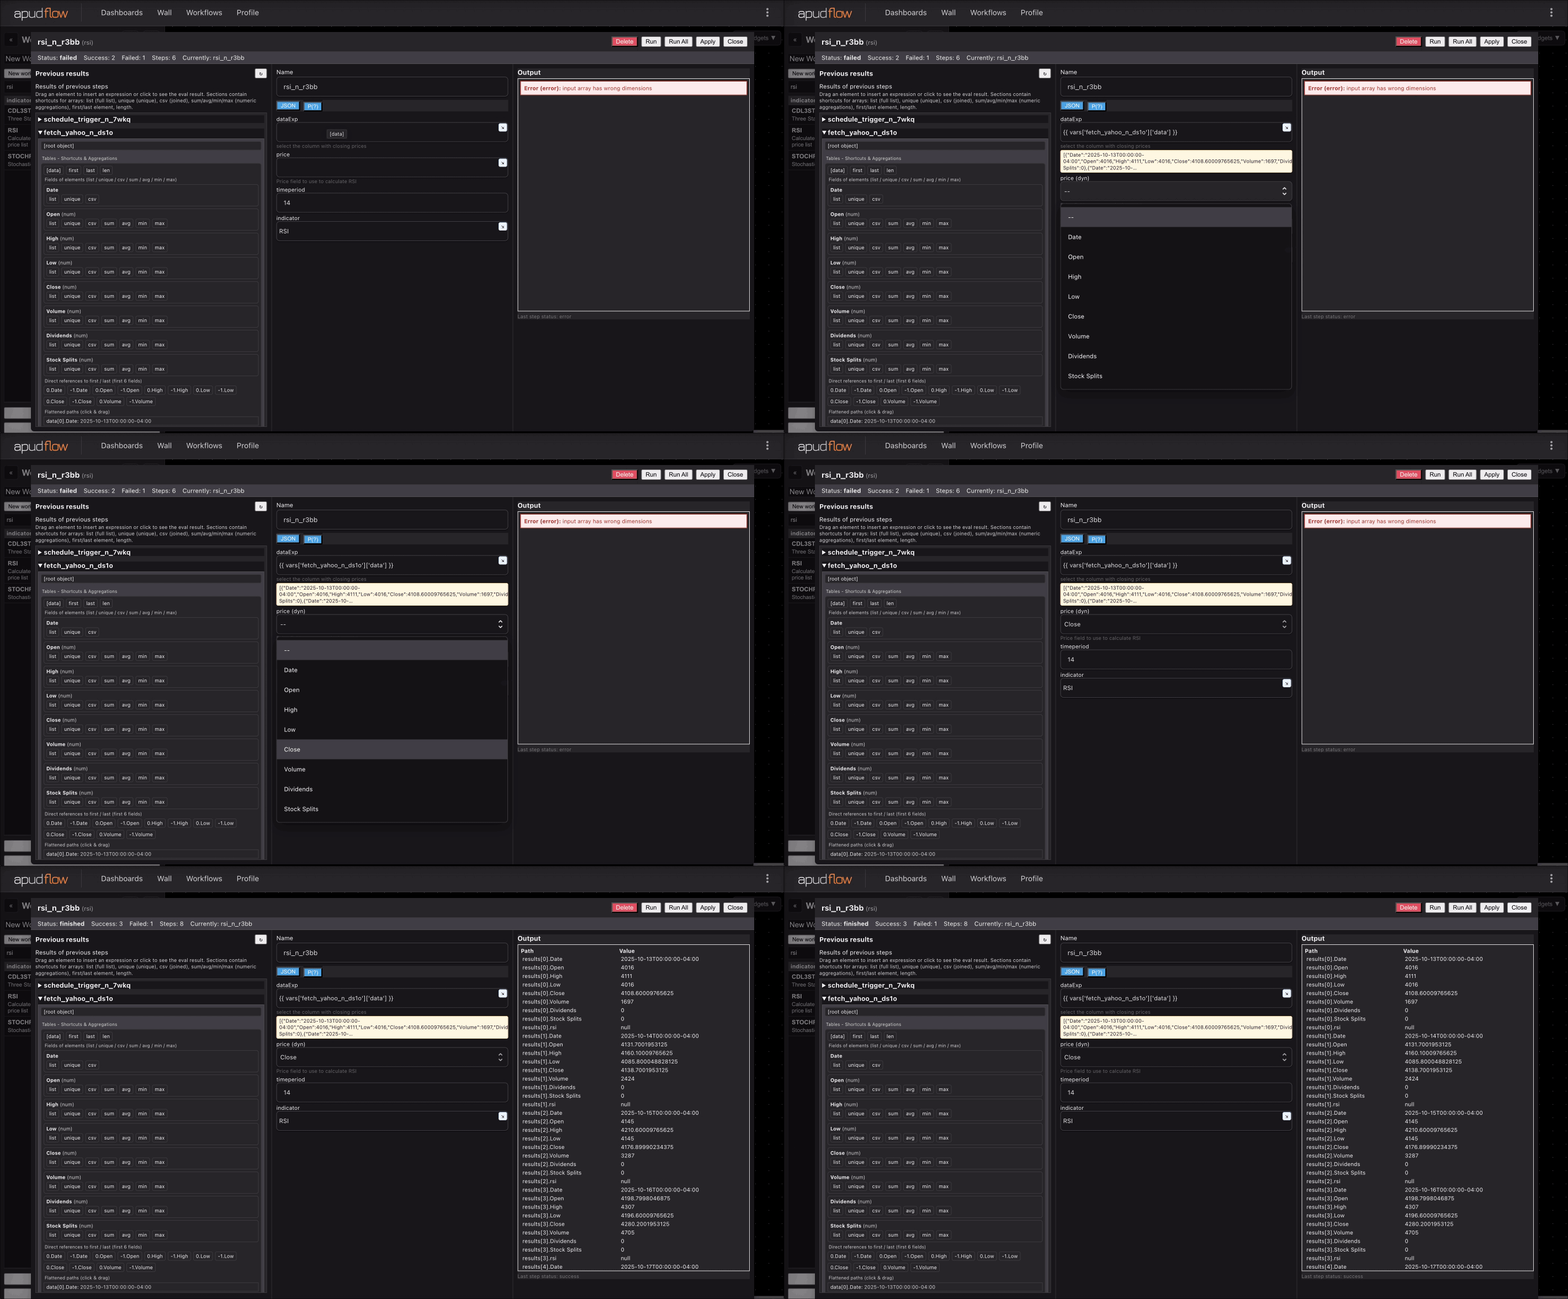
The following images demonstrate how to use the Alpha#52 indicator:


Reference
For more information on the Alpha 101 indicators, including the 101 Formulaic Alphas, please refer to the publication: